Plant material and growth conditions
The 15 African rice cultivars used in this study were the O. sativa cultivars TOS7940 (Accession number WAB0009687), TOS8086 (WAB0009756), TOS8722 (WAB0010137), TOS10589 (WAB0026804), TOS13649 (WAB0025539), TOS13699 (WAB0025692), and TOS14844 (WAB0013700), the O. barthii cultivars TOB7307 (WAB0008667) and TOB14466 (WAB0013402), and the O. glaberrima cultivars JIAKAWO WODEWO (WAB0004306), MB3 (WAB0009234), TOG12380 (WAB0011910), TOG14928 (WAB0013759), C7251 and MARO GOUDO (WAB0006737). All of them except C7251 were provided by the Rice Biodiversity Center for Africa (http://eservices.africarice.org/argis/index.php; Cotonou, Benin). C7251 was purchased from the Genetic Strain Research Center, National Institute of Genetics (Mishima, Japan). All plants, including 3 control Asian rice cultivars (O. sativa) [UVB-resistant Sasanishiki (japonica), UVB-sensitive Norin 1 (japonica) and UVB-hypersensitive Surjamkhi (indica)], were grown and treated with UVB as follows: seeds of each cultivar, soaked in water at 30 °C for 2 d, were sown for 30 d in pots (15 cm wide × 6 cm deep × 10 cm high) containing fertilized soil in a large growth cabinet (Tabai Espec Ltd., Osaka, Japan), with a 12 h/12 h photoperiod and temperatures at 27/17 °C. Five seedlings of each cultivar were grown under visible light supplied by a combination of metal halide lamps (MT 400 DL/BUD; Iwasaki Electric Ltd. Co., Saitama, Japan) and higher-pressure sodium lamps (NH360DL; Iwasaki Electric Ltd. Co.) positioned at the top of the chamber, with a heat-absorbing filter (Tabai Espec Ltd. Co., Osaka, Japan). The heat-absorbing filter eliminated radiation below 350 nm40. Photosynthetically active radiation (PAR) was recorded with a data logger (LI-1000; Li-Cor Inc., Lincoln, NE, U.S.A.) and an L1-190SA sensor (Li-Cor Inc.). The PAR was adjusted to approximately 350 µmol photon/m2/s at the top of the plants. When necessary, plants were grown under visible light supplemented with UVB radiation using three UVB bulbs (FL20SE; Toshiba, Tokyo, Japan) located above the plants. Plants receiving UVB were subjected to the same photoperiod as that of the plants grown with visible radiation. Under the UVB bulbs, a UV29 glass filter (Toshiba Glass Co., Shizuoka, Japan) reduced 290 nm radiation by 50%40. The UVB intensity was measured with a data logger (LI-1000) and an SD-104B sensor (Li-Cor Inc.). The UVB intensity at the plant level was 1.2 W/m2. Spectral distribution was measured with a spectroradiometer (USR-45DA: Ushio Inc., Tokyo, Japan). Biologically effective UVB radiation (14.7 kJ/m2/d) was calculated using the plant action spectrum of Caldwell33 normalized to unity at 300 nm.
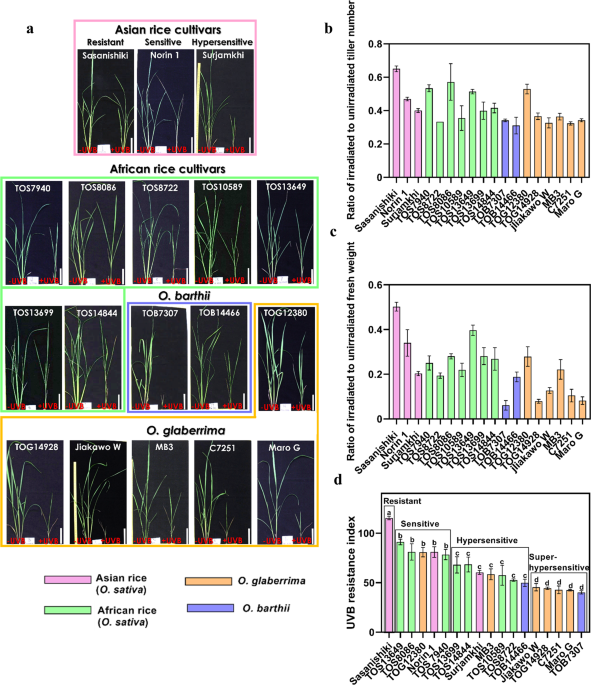
To assess growth, plants were grown for 21 days under visible radiation with or without supplementary UVB radiation in a growth chamber, the tillers were counted, and the above-ground parts were weighed. The value of the middle three of five plants was used for calculating the following scores because poorly performing plants appeared occasionally regardless of UVB treatment. The UVB resistance index was calculated by multiplying the sum of the values of the ratio of irradiated to unirradiated tiller number and the above-ground fresh weight by 10018. To measure the level of transcription of the CPD photolyase gene, photorepair activity using crude extract and activity of CPD photolyase, seedlings were grown for 16 days under visible radiation in a large growth cabinet until the third leaves had expanded fully, and then the third leaves were harvested and used in the experiments. Whole plants were used for purification of CPD photolyase protein and measurements of activity.
Purification of CPD photolyase from rice plants
The CPD photolyase purification methods were modified from Teranishi et al.20. All steps were carried out at 0 °C to 4 °C under dim red light. Protein concentration was determined according to the method published by Bradford41 or estimated from the intensity of the bands on SDS polyacrylamide gels (SDS-PAGE) stained with SYPRO Ruby protein gel stain (Bio-Rad). Band intensity was quantified with Image Lab 6.0 software (Bio-Rad). In both methods, bovine serum albumin (BSA) (Seikagaku Co., Tokyo, Japan) was used as a standard.
Whole plants (20 g) were homogenized in 100 mL buffer A [160 mM potassium phosphate (pH 7.2), 5 mM EDTA, 2 mM dithiothreitol (DTT) and 10% (v/v) glycerol] in a chilled mortar with a pestle. The homogenate was centrifuged at 27,000 × g for 30 min at 4 °C, and the supernatant was used as a crude extract (fraction 1).
Ammonium sulphate (20.8 g) was added to 100 mL of fraction 1 with magnetic stirring to a final concentration of approximately 35% saturation. The mixture was centrifuged as above, and the precipitate was discarded. Ammonium sulphate (33.0 g) was added to 140 mL of the supernatant with gentle magnetic stirring to a final ammonium sulphate concentration of approximately 70% saturation, and the mixture was centrifuged as above. The protein precipitate was dissolved in 30 mL buffer A and dialyzed overnight against buffer B [40 mM potassium phosphate (pH 7.2), 5 mM EDTA, 2 mM DTT, 10% (v/v) glycerol, and 80 mM NaCl] to produce fraction 2.
Fraction 2 (35 mL) was loaded onto an UNO-Q12 anion-exchange column (1.5 cm × 6.8 cm; Bio-Rad) and eluted with buffer B at a flow rate of 2 mL/min. CPD photolyase was recovered in the flow-through (fraction 3). Proteins bound to the UNO-Q12 column were eluted with buffer C [40 mM potassium phosphate (pH 7.2), 5 mM EDTA, 2 mM DTT, 10% (v/v) glycerol, 1 M NaCl] at a flow rate of 2 mL/min.
Fraction 3 (60 mL) was loaded onto a heparin affinity column (1.6 cm × 10 cm; GE Healthcare UK), and the column was washed with buffer B at a flow rate of 1 mL/min. Protein bound to the column was eluted with buffer C at the same flow rate and was dialyzed overnight against buffer B. CPD photolyase was recovered in this fraction (fraction 4).
Finally, CPD photolyase was purified with UV-irradiated DNA-conjugated magnetic beads. The surfaces of all tubes and magnetic beads used in the final purification were blocked by incubating them 2 or 3 times with 0.1 mg/mL BSA, followed by 2 or 3 washes with buffer B to remove unbound BSA. A 5′-biotinylated 42-mer oligonucleotide (5′-ATGGCGCCAGACGTACTAATGTGTATACACGCGTGCATGATC-3′) and a complementary unmodified 42-mer oligonucleotide (5′-GATCATGCACGCGTGTATACACATTAGTACGTCTGGCGCCAT-3′) were synthesized by Kurabo Industries. To generate CPDs, the unmodified oligonucleotide [100 nmol/mL in 1 × Tris-EDTA (TE) buffer (10 mM Tris-HCl, pH 8.0, 1 mM EDTA)] was irradiated with a germicidal lamp (Toshiba; 254 nm, 10 W/m2) for 8 h and was then mixed with the same amount of the 5′-biotinylated oligonucleotide. The mixture was boiled for 5 min and allowed to anneal by cooling slowly to room temperature. The resulting double-stranded DNA (1.5 nmol) was conjugated to 6 mg streptavidin-coated magnetic beads (Magnotex-SA; Takara Bio Inc., Shiga, Japan). Fraction 4 (5 mL) was mixed with 0.3 mL UV-irradiated DNA conjugated to magnetic beads and incubated at 4 °C for ≥8 h. The beads were collected with a magnet, washed five times with 1 mL buffer B, and bound proteins were eluted with buffer C to recover CPD photolyase (fraction 5). The eluate was dialyzed overnight against buffer D [40 mM potassium phosphate (pH 7.2), 5 mM EDTA, 2 mM DTT, 10% (v/v) glycerol, and 4 mM NaCl]. The dialysate was concentrated 10 times under N2 flow on ice in the dark and was dialyzed overnight against buffer B. Proteins were separated by SDS-PAGE in 7.5% or 12.5% (w/v) gels and stained with SYPRO Ruby. The band intensity was quantified with Image Lab 6.0.
DNA sequencing
The procedure for DNA extraction has been previously described17. Each PCR mixture contained genomic DNA (1 µg) as a template, 0.2 mM dNTPs, 2.0 mM MgCl2, 0.02 U/mL Ex Taq polymerase (Takara Bio Inc.) and 100 nM each of the following sets of primers. The primers Glf-F1 (5′-CACAAACGCACGCCCGCA-3′) and GSP4 (5′-GGCTCACACCAGTCAATCTCCGGC-3′) were used to amplify a 1147-bp DNA fragment (exons 1–4 of the rice CPD photolyase gene). The primers H1 (5′-GCGTCGGCGAAGATGGAGTAT-3′) and Rice3 (5′-CCGAGCTCGTGGTATACCACACAAAGAAATG-3′) were used to amplify a 2878-bp DNA fragment (exons 3–10). PCR was performed in a thermal cycler (Bio-Rad) for 35 cycles of 98 °C for 20 s, 70 °C for 30 s and 72 °C for 2 min, followed by a final extension at 72 °C for 10 min. The PCR products were treated with ExoSAP-IT (Amersham Biosciences) to remove primers and free dNTPs and sequenced using the BigDye Terminator Cycle Sequencing Kit (Applied Biosystems, Norwalk, CT, USA).
Measurement of CPD photolyase activity
Fully expanded third leaves (0.08 g) were homogenized in 400 µl 40 mM potassium phosphate, pH 7.2, 5 mM EDTA, 2 mM DTT, 0.2 g/L BSA, and 10% (v/v) glycerol using a chilled mortar and pestle. The homogenate was centrifuged for 20 min at 20,000 × g and 4 °C, and the supernatant was desalted by passage through a Bio-Gel P6DG spin-column (Bio-Rad) and used as a crude extract to measure photolyase activity. The total soluble protein content was determined according to the method published by Bradford41 using BSA as the standard.
In vitro photolyase activity was measured as described in detail in ref. 42. CPD frequencies were determined using a DNA damage analysis system (Tohoku Electric Co., Miyagi, Japan) as described previously43. CPD frequencies (CPD/Mb) were calculated using a molecular length standard curve, and the quantity of DNA at each migration position was determined by quantitative imaging44,45.
Transcript levels of CPD photolyase enzyme; RNA extraction, cDNA synthesis and quantitative real-time RT PCR analysis
Total RNA was extracted from whole seedlings with an RNeasy Plant Mini Kit from Qiagen and treated with DNase I (Qiagen). Reverse transcription was performed with an oligo(dT) primer and a random 6-mer mixture using a Prime Script RT Reagent Kit (Takara Bio Inc.). The PCR primers were 5′-CCGTCGATGCTTTCTTGGAGG-3′ and 5′-CATCTCCAACTGCGATGCATTCCA-3′, which amplify the coding region of CPD photolyase (nucleotides 935 to 1159). The actin gene was used as an internal control, and the actin primers were 5′-GAAGATCACTGCCTTGCTCC-3′ and 5′-CGATAACAGCTCCTCTTGGC-3′. Real-time PCR was performed using SYBR Green to monitor double-stranded DNA synthesis (CFX96, Bio-Rad). The amounts of cDNA were calculated by the delta CT method.
Purification of the E. coli-expressed rice CPD photolyase
The plasmid pGEXOsPHR was constructed as previously described46. This plasmid encodes an N-terminal fusion of glutathione S-transferase containing a thrombin protease recognition site to CPD photolyase derived from a cDNA sequence from the rice cultivar ‘Sasanishiki’. An inverse, PCR-based, site-directed mutagenesis reaction was performed using a KOD-Plus-Mutagenesis Kit (Toyobo Co., Ltd.) according to the manufacturer’s instructions. The E. coli strain KY20 (JM107 + phr20∷Kan) was transformed with pGEXOsPHR (Sasanishiki), pGEXOsPHR (P78-R126-A283-Q296) and pGEXOsPHR (S78-R126-A283-Q296) and grown as previously described46. All subsequent steps were carried out at 0 °C to 4 °C under dim red light. Cells were harvested and resuspended in buffer B and disrupted by sonication for 30 min. Sonicated cells were centrifuged at 27,000 × g for 30 min at 4 °C, and the supernatant was collected and loaded onto a Glutathione-Sepharose 4B column (1 cm × 5 cm, containing 5 mL resin; GE Healthcare UK). The column was washed with buffer B. The outlet of the column was then closed, and buffer B containing 10 units/mL thrombin protease was added. The column was closed at the top and incubated at 25 °C for 12 h. After protease digestion, the solution, including CPD photolyase, was eluted from the column.
Measurement of absorption
Absorption spectra of the purified native rice CPD photolyase and the E. coli-expressed rice CPD photolyase were obtained with a spectrophotometer (JASCO V-550).
Isotopic labelling of DNA and electrophoretic mobility shift assay
A 30-mer oligonucleotide (5′-CACGTACGCATCTTCTACGTACCGACAGTC-3′) containing or non-containing a centrally located thymine dimer was used in this experiment47. Sixty picomoles of oligonucleotide containing or not containing a thymine dimer were reacted with [γ–32P]ATP using T4 polynucleotide kinase (TaKaRa Bio Inc.) for 30 min at 37 °C. Unincorporated [γ–32P]ATP was removed using a Sephadex G-25 column (GE Healthcare UK). The oligonucleotide was then annealed with the complementary oligonucleotide (5′-GACTGTCGGTACGTAGAAGATGCGTACGTG-3′) in annealing buffer (10 mm Tris-HCl [pH 8.3] and 10 mm MgCl2) by heating at 95 °C for 5 min and cooling to 30 °C over a 30-min period. The duplex DNA was precipitated with ethanol and resuspended in 1 × TE buffer. Zero to 400 ng of the E. coli-expressed rice CPD photolyase was added to 0.3 pmol of the 32P-labelled DNA substrates in the binding buffer (40 mm potassium phosphate buffer, pH 7.2, 5 mm EDTA, 2 mm DTT, and 80 mm NaCl) in the dark at 25 °C for 15 min. Then, electrophoresis was performed in a 10% (w/v) nondenatured polyacrylamide gel. After electrophoresis, the band intensity of the radiolabelled oligonucleotides on the gel was measured with a fluoro-image analyser (FLA-2000; Fuji Photo Film).
Visualization of the CPD photolyase 3D structure by PyMol software
PyMol 2.2.2 software from Schrodinger was used as a comprehensive software package for rendering and animating 3D structures by using amino sequence information of the selected cultivar TOB7307. Then, the CPD 3D structure was constructed focused on amino acid interest in cultivar TOB7307 compared to that of Sasanishiki (protein data bank code: 3UMV)22.
Phylogenetic analysis
Genomic sequences of the Asian rice cultivars Sasanishiki, Norin 1 and Surjamkhi were obtained from the DDBJ/EMBL/GenBank database (accession nos. AB096003, AB099694 and AB125340, respectively). The orthologous sequences of other rice species were obtained from the EMBL-EBI database under the following transcript IDs: Os10t0167600-02 for Oryza sativa ssp. japonica, OB10G12750 for Oryza brachyantha, ORGLA10G0028500.1 for Oryza glaberrima, OBART10G03590 for Oryza barthii, OGLUM10G03610.1 for Oryza glumaepatula, KN540024.1_FGT005 for Oryza longistaminata, OMERI10G02990.1 for Oryza meridionalis, ONIVA12G06340.1 for Oryza nivara, OPUNC10G03030.1 for Oryza punctata, ORUFI10G03840.1 for Oryza rufipogon, BGIOSGA032246 for Oryza sativa ssp. indica and LPERR10G02700.1 for Leersia perrieri. In total, 29 nucleotide sequences (761 positions per sequence after elimination of positions containing gaps and missing data) were included in the analysis. The evolutionary history was inferred using the UPGMA method48 in MEGA749. The optimal tree had a sum of branch lengths of 159.1. The tree was drawn to scale, with branch lengths in the same units as those of the evolutionary distances used to infer the tree, which were computed using the number of differences method50 and are in the units of the number of base differences per sequence.
Statistical analyses
Statistical analyses were performed using Microsoft Office Excel 2016 (Microsoft Co., Redmond, WA, USA), GraphPad Prism version 8.00 (GraphPad Software, San Diego, CA, USA) and R programming language (https://www.r-project.org/).
Source: Ecology - nature.com
