Cage experiment
Cage experiments over two years identified significant differences in the pollination dependency of the five faba bean cultivars tested. There were no differences between the effect of tripping and cross pollination treatments in any cultivar or yield parameter measured (no significant posthoc contrast between any tripping and crossing treatments on the same cultivar) so analyses were conducted with these treatments grouped with no reduction in explanatory power (comparison between ANOVA testing bean number and 2 way interaction of cultivar and pollination with either 3 or 2 levels, F = 0.726, p = 0.699).
The effect of pollination treatment varied significantly with cultivar for total bean number per plant (interaction between cultivar and pollination treatment; F = 11.4, p < 0.001), total bean mass per plant (F = 4.561, p = 0.001; Fig. 1), total pod number per plant (F = 9.384, p < 0.001) and average number of beans per pod (F = 2.68, p = 0.032), see Table 1. Diana07 and Fuego produced a greater number of beans when a pollination treatment was applied (posthoc tests between selfing and pollination treatments for bean number; p < 0.05) while Hedin/2 produced fewer beans following the pollination treatments (p = 0.006). No cultivars, when taken independently of each other (within cultivar post-hoc contrasts), showed a significant difference between the selfing and pollination treatments for bean mass (though Diana07 was close to significant, p = 0.056). Effects of pollination treatments varied between cultivars depending on the yield parameter in question; for number of beans per pod there was no difference between selfing and additional pollination treatments for Hedin (p = 0.999), Vertigo (p = 0.875), or Diana07 (p = 0.069) while beans per pod increased with pollination by an average of 0.9 in Fury (p = 0.003) and 0.6 in Fuego (p = 0.033). Results were highly variable within individual combinations of pollination treatment and cultivar, see Supplementary Material for extended results table.
The relative pollination dependence of cultivars was consistent across years (3-way interaction of pollination treatment, cultivar and year was not significant for bean number; F = 0.8, p = 0.53, bean mass; F = 0.18, p = 0.95, pod number (F = 1.0, p = 0.4), and beans per pod (F = 1.1, p = 0.4). There was however a large difference in the absolute yield produced between years (c. 27 fewer beans per plant on average in 2018) which resulted in different effects of pollination treatment on yield between the two years (interaction treatment and year for bean number; F = 17.8, p < 0.001, bean mass; F = 5.7, p = 0.017, pod number; F = 8.3, p = 0.004; not significant for beans per pod; F = 1.2, p = 0.28) and different effects of cultivar on yield between the two years (interaction cultivar and year for bean number, F = 6.2, p < 0.001, not significant for bean mass, F = 1.3, p = 0.3, pod number, F = 1.8, p = 0.1; or beans per pod F = 1.0, p = 0.4).
The dominant floral node, around which pods were grouped on the stem, was quantified for each experimental plant in the cage experiments (Fig. 2). There was no difference between the two pollination treatments of tripping and hand- pollination, indicating that cross pollination does not change the distribution of pods on the stem compared to tripping (model including 2 vs 3 factor levels for pollination treatment; p = 0.99). Diana07 showed a significant difference in dominant node position between pollination treatments while other cultivars did not (interaction pollination treatment and cultivar; F = 4.841, p < 0.001). The location of the dominant node was also different between years (1 node lower in 2017; year; F = 4.023, p = 0.046) but relationships between pollination treatments and cultivars did not vary between years (3-way interaction of year, cultivar and pollination treatment; F = 1.532, p = 0.19).
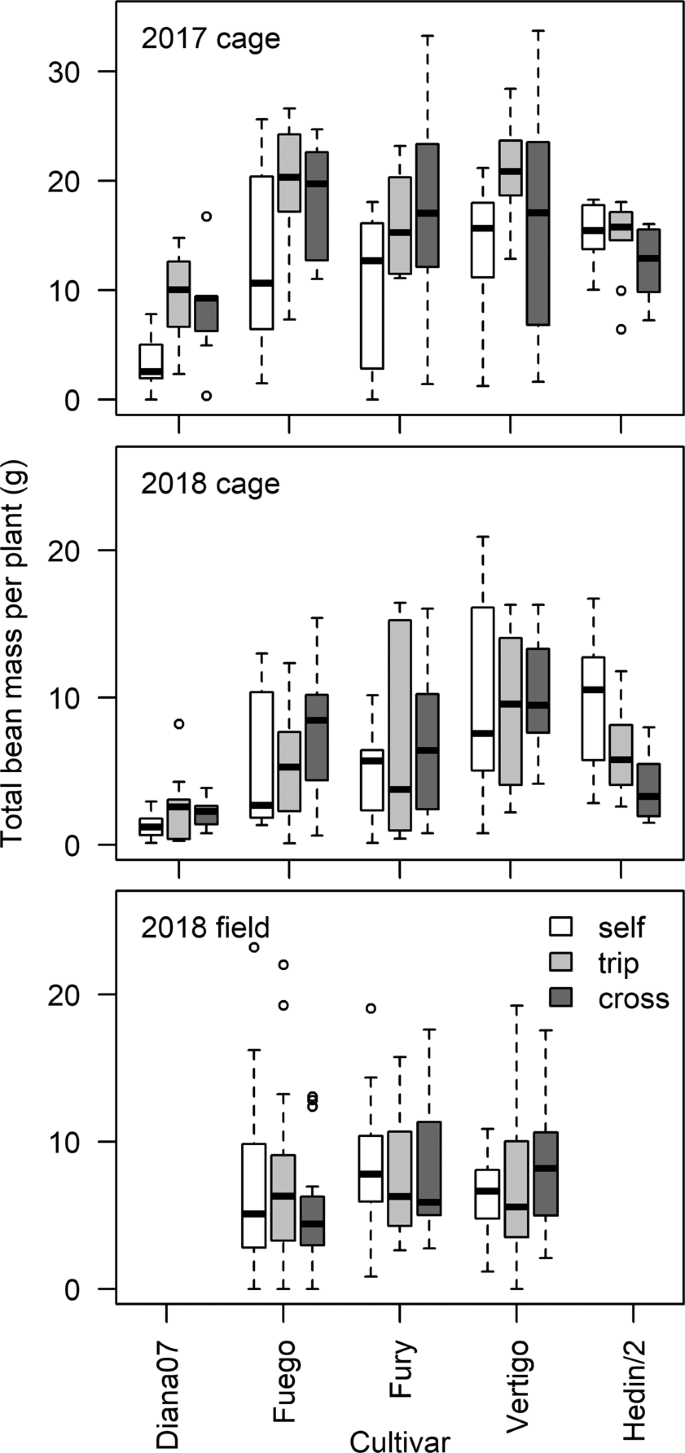
Effect of cultivar, pollination treatment and experimental method on yield mass per plant.
There was a non-linear relationship between total bean number and total bean mass per plant (a model including log(bean number +1) and log(bean mass +1) had the best fit) indicating that mass per bean became progressively lower in plants with more beans (Fig. 3). The different cultivars and the three pollination treatments altered this relationship (deletion test for interaction of bean number, pollination treatment and cultivar; F = 3.067, p = 0.003; comparison between model including pollination with either 3 or 2 levels, F = 2.744, p = 0.002). Fury (p = 0.023) and Vertigo (p = 0.024) plants receiving hand pollination maintained significantly more mass as their number of beans increased compared to Diana07 plants (Fig. 3) indicating that Fury and Vertigo were less affected by resource limitation than Diana07.
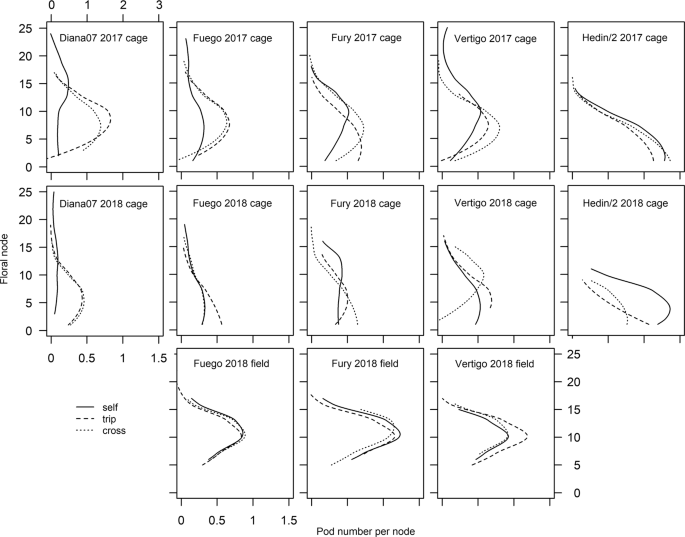
Distribution of pod number per floral node for each cultivar and pollination treatment. Lines are estimated using local polynomial regressions across all replicate plants.
Field experiment
Pollination treatments had no significant effect on seed number in the field experiment (interaction between cultivar and pollination treatment, F = 1.03, p = 0.395; pollination treatment, F = 0.09, p = 0.907). Seed number did vary between cultivars (cultivar F = 3.461, p = 0.033) with Fury producing a greater number of seeds than Fuego (p = 0.028) but not Vertigo (p = 0.297). There were no significant differences in the total mass of beans per plant between cultivar or pollination treatments (interaction cultivar and treatment, F = 1.19, p = 0.32; pollination, F = 0.24, p = 0.79; cultivar, F = 1.8, p = 0.16; Fig. 1). See Supplementary Material for extended results table.
There were no differences in pod distribution on the stem (e.g. dominant floral node) between pollination treatments or cultivars (interaction pollination treatment and cultivar; F = 1.101, p = 0.357; pollination treatment; F = 0.761, p = 0.469; cultivar; F = 2.732, p = 0.068).
There was again a non-linear relationship between total bean number and total bean mass per plant (model including log(bean number +1) and log(bean mass +1) had the best fit; Fig. 3). The relationship did not vary between the cultivars tested (deletion test for interaction of bean number, pollination treatment and cultivar, F = 1.344, p = 0.25; deletion test for cultivar, F = 0.682, p = 0.507) or pollination treatments (interaction pollination treatment and bean number; F = 1.462, p = 0.215).
Correlation coefficients between yield parameters ranged from 0.15 (rho, p = 0.026; bean per pod and bean mass in field experiment) to 0.96 (rho, p < 0.001; pod number and bean number in 2017 cage experiment), correlations between all measured yield parameters are presented in Fig. 4.
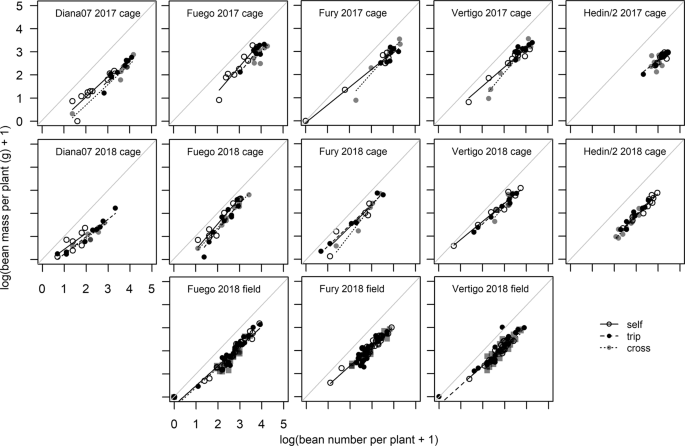
Relationships of total bean number and total bean mass per plant. Lines show model predictions for different pollination treatments and points show data; cross treatment in field experiment is uncaged plants. Diagonal gray lines show 1:1 relationship.
Economic analysis
Pollination dependence varied widely between the cultivars, year, whether the experiment was conducted in cages or in the field, and which yield parameter was used (Table 1). Total bean and pod number per plant showed a wide range of dependence (bean number +75% for Diana07 to −50% for Hedin/2 in 2018; pod number +62% for Diana07 to −55% for Hedin/2 in 2018) while average number of beans per pod, and total bean mass per plant showed a smaller range in dependence between cultivar and treatment combinations. This variation between yield parameters with cultivar and other contextual factors leads to different estimates of the benefits of pollination services for faba bean. Using bean number alone gives an estimate of economic impact of between −£281.27/ha to £425.24/ha, pods alone −£309.14/ha to £351.36/ha, and yield mass −£287.29/ha to £354.69/ha. Extrapolating up to the whole country and assuming only one cultivar is grown, this produced estimates of benefits ranging between −£55.6M (lowest benefit, Hedin/2, pod number) to £76.4M (highest benefit, Diana07, bean number) (Table 2).
Source: Ecology - nature.com

