NPP and GPP models
Important advances in NPP and GPP models for estuarine-coastal waters were made possible by increasingly sophisticated approaches and availability of calibration data. Common elements of production models dating to the 1950s include terms for photosynthetic efficiency, phytoplankton biomass, and light availability41,42,43,44,45,46,47,48,49,50,51,52. Light-utilization models specific to estuarine-coastal ecosystems, such as Chesapeake Bay, San Francisco Bay, and mid-Atlantic coastal waters, relied on observations of euphotic-layer chl-a, incident irradiance (E0), light attenuation coefficient (KPAR), NPP, and GPP11,14,48,49,50. In 1997, Behrenfeld and Falkowski developed VGPM, a depth-integrated model applied to ocean-color data from SeaWiFS (Sea-viewing Wide Field of View Sensor) and MODIS (Moderate Resolution Imaging Spectroradiometer) that provide global coverage of NPP8. In 2002, we developed the Chesapeake Bay Production Model (CBPM) as the published form of VGPM overestimated NPP and GPP for the bay7. Stepwise regressions of log-transformed variables from VGPM led to CBPM that supported estimates of NPP from aircraft and satellite ocean-color data31,53.
Here, we departed from VGPM and CBPM to develop production models for the bay using GAM. Selection of predictor variables for NPP and GPP models was informed by earlier studies on a subset of these data from LMER TIES cruises (Table 1). Analysis of variance (ANOVA) showed that season and region explained most of the variability of phytoplankton properties, including NPP, chl-a, and floral composition54. Long-term (six-year) means of NPP were negatively correlated with the fraction of chl-a in diatoms, a property stimulated by high-flow, “wet” conditions. Multiple linear regression and principal component analysis identified SRF as a ‘master variable’ driving inter-annual variability of these properties. An important advantage of transitioning to GAM was the flexibility to include predictor variables such as SRF to adjust for climatic effects on hydrology and distinguish variability from trends.
Model forms developed here were guided by these findings, leading us to include predictor variables for salinity zone, salinity, month, season, year, and flow terms log10 SRF and log10 SUM (Table 3). These models proved effective to estimate NPP and GPP, exemplified by simple, linear regressions of observed vs. modeled log10 NPP from gam2 with R2 > 0.96 (Fig. 6a–c), and log10 GPP from gam2 with R2 > 0.80 (Fig. 6d–f). These fits are comparable to NPP estimates using CBPM with measured values of PBopt, and GPP estimates using CBPM with estimated values of PBopt7. Predictor variables in models of NPP for OH, MH, and PH salinity zones consistently showed highest F-values and lowest p-values for log10 PBopt and log10 euphotic-layer chl-a (Table 3). Several other terms were also significant predictor variables, i.e., TN and NO2 + NO3 loadings (OH salinity zone), salinity, month (MH salinity zone), and salinity, KPAR, SRF, and month (PH salinity zone).
Climatic effects
Our group has focused on climatic effects on hydrology impacting water quality and phytoplankton in recent studies of Chesapeake Bay16,17,18,19. Adolf et al.54 explored this theme previously, reporting predictable consequences of SRF on phytoplankton dynamics. Statistical models based on long-term data extended these findings, documenting climatic effects on chl-a, floral composition, and NPP16,17,18,19. A logical sequence emerged from these studies wherein seasonal to interannual variability of freshwater flow and N loading regulates spatio-temporal distributions of phytoplankton16,17,18,19, consistent with the conclusion by Malone et al.22 that P plays a limited, transient role in the OH salinity zone of the bay, while N limits phytoplankton biomass and production on the ecosystem scale.
Despite evidence from shipboard, aircraft, and satellite data linking freshwater flow to phytoplankton dynamics in land-margin ecosystems, previous NPP and GPP models did not contain explicit terms for climatic effects on hydrology12,13,14,51,52,54,55,56,57,58,59,60. Analyses described here addressed this shortcoming, based on observations in Chesapeake Bay spanning several decades. Specifically, low-flow, “dry” conditions produce a landward shift of N-limitation toward OH and MH salinity zones, lower chl-a, lower NPP, and a lower proportion of diatoms in the phytoplankton flora; high-flow, “wet” conditions extend the area of N sufficiency seaward to MH and PH salinity zones, leading to higher chl-a, higher NPP, and a higher proportion of diatoms16,17,18,19,54,60. Climatic effects on bio-optically active constituents similarly affect light-limitation as higher inputs of dissolved and suspended materials occur for high-flow, “wet” conditions than for low-flow, “dry” conditions16,18. This latter observation may contribute to lower sensitivity of NPP than chl-a to climatic variability reported here (Fig. 10a–f).
Development of numerical water-quality criteria followed this logic, leading to model predictions that distinguished long-term trends from spatio-temporal variability18. Freshwater flow from the Susquehanna River, and frequencies of predominant weather patterns defined “dry” and “wet” conditions53,60,61,62, and statistical models conditioned on specific input terms for flow and salinity supported predictions of mean, monthly chl-a, Secchi depth, and NO2 + NO319. Here, we extended this approach to NPP and GPP models by including terms to adjust for climatic effects on hydrology (Tables 3, 5; Fig. 10a–f). This approach benefited from the flexibility of GAM to incorporate predictor variables traditionally used in production models, i.e., PBopt, chl-a or euphotic-layer chl-a, Zp, and SST, and to add variables for salinity zone, salinity, season, SRF, and TN and NO2 + NO3 loadings.
APPP
Cloern et al.4 published a synthesis of APPP for estuarine-coastal ecosystems based on a comprehensive survey of the scientific literature. APPP for 131 ecosystems ranged from 105 to 1890 g C m−2 yr−1, with a mean of 252 g C m−2 yr−1. Ten-fold variability occurred within ecosystems and five-fold from year to year, with only eight time-series covering longer than a decade. One of the best-studied ecosystems in the survey was the Rhode River, a small sub-estuary adjacent to the MH salinity zone of Chesapeake Bay. Long-term measurements of photosynthesis by Gallegos63 supported estimates of APPP ranging from 152 to 612 g C m−1 y−1 in the Rhode River, with a mean of 328 g C m−1 y−1. APPP maxima occurred in years with dense spring blooms of Prorocentrum cordatum (formerly P. minimum) a dinoflagellate species that commonly forms “mahogany tides”. Complex interactions of local and remote nutrient inputs affected the relationship of APPP in the Rhode River to SRF. High-flow conditions displaced the turbidity maximum, usually located in the OH salinity zone, south of the Rhode River mouth, causing elevated turbidity in the sub-estuary, washout of phytoplankton, suppression of the spring bloom, and decreased APPP.
Models of NPP calibrated with long-term measurements in Chesapeake Bay from 1982 to 2004 supported multi-year estimates of APPP, based on water-quality properties from 1985 to 2015 as model inputs. These estimates of APPP allowed us to resolve inter-annual variability for a three-decade span, rarely possible for estuarine-coastal ecosystems per Cloern et al.4. Seasonal to inter-annual variability of NPP and thus APPP can be traced to euphotic-layer chl-a, a predictor variable that is highly sensitive to climatic effects on hydrology. We previously related inter-annual variability of APPP to TN and TP loadings, based on the supply of new nutrients from the Susquehanna River during the winter–spring freshet7. Stepwise regressions tested time lags between the seasonal pulse of nutrients and maximum NPP in summer, identifying mean, monthly TN and TP loads in February and March as predictors of APPP. Models of NPP developed here used a different approach to capture climatic effects on hydrology, explicitly accounting for variability of freshwater flow and nutrient loadings with predictor variables. The resulting model predictions of NPP supported estimates of APPP, resolving inter-annual variability and long-term trends from 1985 to 2015 (Fig. 11a–c).
Nixon’s trophic classification, historical context
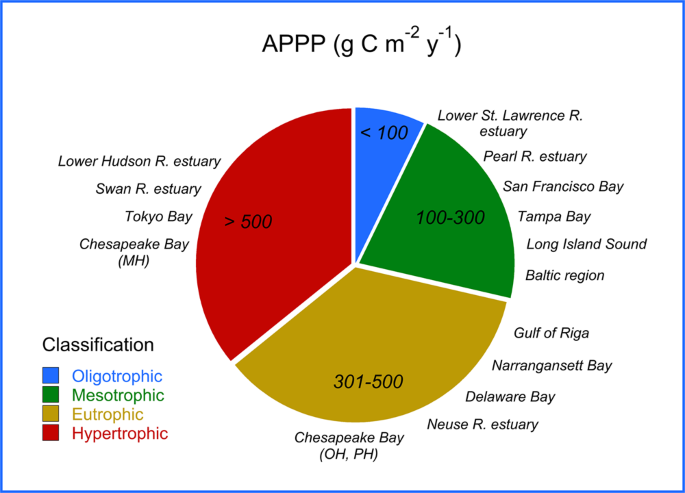
Mean-flow predictions of NPP were used to estimate APPP from 130 to >600 g C m−2 y−1 for OH, MH, and PH salinity zones, with increases from 1985 to 2015 matching euphotic-layer chl-a (Fig. 11a–c). APPP of this magnitude corresponds to “eutrophic” for OH and PH salinity zones, and “hypertrophic” for the MH salinity zone using Nixon’s3 trophic classification (Fig. 1). According to Cloern et al.4, Chesapeake Bay ranks among estuarine-coastal ecosystems that are heavily impacted by nutrient over-enrichment (their Fig. 4). We evaluated prospects for changing trophic classification based on APPP by simulating 40% reductions of biomass or nutrient loadings in models of NPP. These reductions of euphotic-layer chl-a or TN and NO2 + NO3 loadings led to decreased APPP and changed trophic status from “hypertrophic” to “eutrophic” for the MH salinity zone, and from “eutrophic” to “mesotrophic” for OH and PH salinity zones (Fig. 11a–c).
Simulated 40% reductions of euphotic-layer chl-a or TN and NO2 + NO3 loadings were based on goals established by the 1987 Chesapeake Bay Agreement64 to reduce phytoplankton biomass sufficiently to reverse summer anoxia. Several interventions by management began in the 1980s when states bordering the bay banned phosphate in laundry detergents. Subsequent nutrient-management legislation was adopted by Maryland, Virginia, and Pennsylvania in the 1990s, aimed at reducing the over-application of commercial fertilizers and manure on agricultural lands. In 2004, the six states in the watershed, the District of Columbia, and U.S. EPA reached an agreement on comprehensive wastewater treatment permits, leading to numerical annual loading limits for over 470 municipal and industrial wastewater treatment facilities. In December 2010, total manageable daily loads (TMDL) were adopted by U.S. EPA in collaboration with the six states and the District of Columbia. These agreements committed to significant reductions of nutrient and sediment loads by 2025, development of locally based watershed implementation plans, and an accountability system including annual milestones and public reporting of progress.
Together, these actions have led to modest progress toward improved water quality and changes in phytoplankton ecology in the bay16, although additional nutrient reductions must be reached to decrease APPP and change trophic classification. Our analyses of long-term trends showed flow-adjusted TN and NO2 + NO3 loadings doubled from 1945 to 1981, followed by decreases of 19.2% and 5.3% from 1981 to 201216. The slow, upward trajectory of flow-adjusted chl-a for the MH salinity zone is consistent with shallow, downward trends of TN and NO2 + NO3 loadings in recent years16,18. We point out that simulated 40% reductions of euphotic-layer chl-a or nutrient loadings exceed actual progress since the 1980s, explaining the continuing increases of APPP based on mean-flow model predictions of NPP (Fig. 11a–c).
Decadal contrasts of NPP and APPP in the 1960s and 1970s (Fig. 12a–f) reflected a combination of water-quality management and climatic effects: (1) lower inputs of bio-optically active constituents in the 1960s accompanied a sequence of low-flow, “dry” years compared to the 1970s, reducing light-limitation for OH, MH, and PH salinity zones and enhancing NPP and APPP; (2) removal of orthophosphate (PO43−) from detergents enhanced P-limitation in the OH salinity zone, leading to increased N-throughput to MH and PH salinity zones, and reductions of NPP and APPP from the 1960s to the 1970s; (3) model predictions of NPP for low-flow, “dry”, mean-flow, and high-flow, “wet” conditions were based on predictor variables for flow and salinity that adjusted for climatic effects, with mean-flow predictions of NPP and APPP reflecting these adjustments in the 1960s and 1970s.
Model predictions of NPP from historical reconstructions and recent years led to comparable estimates of APPP for the MH salinity zone. Mean-flow model predictions of NPP produced estimates of APPP >500 g C m−2 y−1 from 2010 to 2015 (Fig. 11b), similar to APPP for the same salinity zone in the 1960s (Fig. 12b). Analogous estimates for OH and PH salinity zones showed a similar pattern, with APPP in the 1960s higher than in recent years. APPP was lower for all three salinity zones in the 1970s than in the 1960s (Fig. 12d–f). These observations and predictions provide historical context for comparison with contemporary conditions, suggesting APPP today is not appreciably different from past rates. We found evidence of lower APPP for MH and PH salinity zones in contemporary estimates, and sensitivity of APPP to reductions of euphotic-layer chl-a or TN and NO2 + NO3 loadings. These findings show promise for future reductions of APPP in response to improvements of water quality that would be required to change trophic classification.
Source: Ecology - nature.com
