We first compared the vertical variation in WD between 822 individual trees by determining WD in six compartments (stump: Stu, stem base: Steb, stem: Ste, large-: LB, medium-: MB and small-sized branches: SB, Fig. 1D). The sample covered a broad range of WD values from 0.217 to 1.020 (Steb). As there are no strong assumptions regarding the mathematical form of these variations, we used a scaled principal component analysis (PCA) to evaluate relative vertical gradients in WD. Prior to the analyses, the WD values of each tree compartment were normalized by the individual mean WD (Fig. 1A). The first PCA axis (PCA1, Fig. 1B) distinguished the tree base (stump and stem base) from the tree crown (large-, medium- and small-size branches), while stem relative WD was positively correlated with PCA2. Therefore, trees with negative scores on PCA1 exhibited a relatively high stump WD (WDStu) and a decreasing WD toward the smallest branches (e.g., Pentaclethra macrophylla). With increasing scores on PCA1, the relative vertical profile of WD became progressively convex (for high PCA2 values, e.g., Gilbertiodendron dewevrei) or constant (for low PCA2 values) and eventually increased toward the small branches (e.g., Poga oleosa). For 83% of the sampled trees, WD was lower in the small branches than in the stump by an average of −13.3%, with individual differences ranging within approximately ±60% (Fig. 1E). When averaging gradients at the species level, a vertical decrease was observed in 88% of the species, with a range of ±30%. Species PCA scores and other characteristics are summarized in Suppl. Table 1.
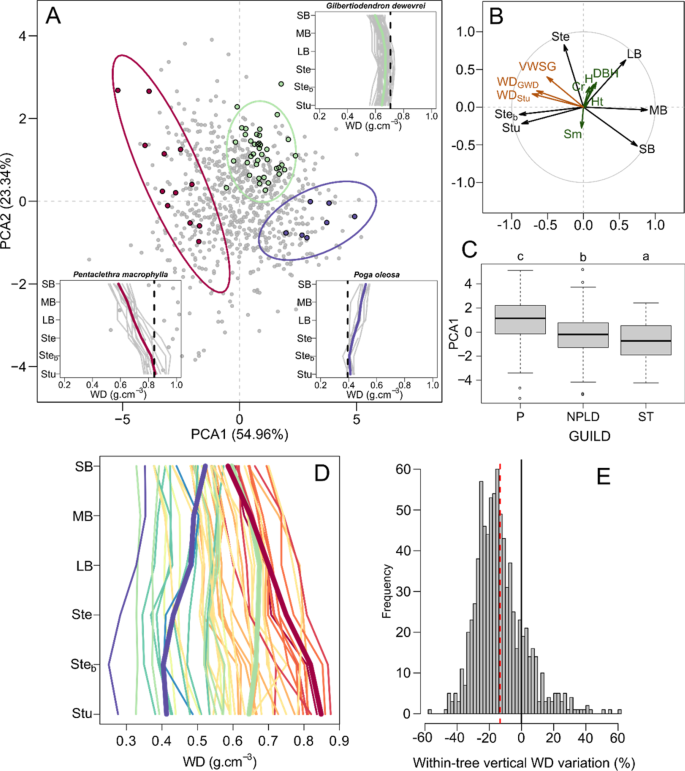
Ordination of wood density (WD) vertical profiles based on principal component analysis. Panel A: Scatter plot of PCA scores on the first two principal axes. Insets showing vertical WD profiles are highlighted for three contrasting species, with vertical dashed lines representing species mean WD derived from the Global Wood Density database. Panel B: Correlations between the WD of each tree compartment (black arrows) and the first two PCA axes. Supplementary variables related to wood density and tree structure are plotted in maroon and dark green, respectively (see Table 1 for acronyms and definitions). The histogram of eigenvalues is provided in Fig. S1. Panel C: Boxplot of PCA1 scores of individual trees by life strategy guild (pioneer: P, nonpioneer light-demanding: NPLD and shade tolerant: ST). The post hoc Tukey’s HSD test is indicated (p-value < 0.01, see Table S2 for details). Panel D: Species mean WD by tree compartment. The warm-to-cold color gradient represents the species mean PCA1 score. The three focal species from panel A are shown with thicker lines. Panel E: Histogram of tree WD differences between the small branches and the stump as the percent of the stump WD (n = 822). The dashed red vertical line represents the distribution mean.
Identifying correlates of WD vertical profiles
The relative vertical profiles in WD were strongly correlated with tree basal WD, with a significant correlation coefficient (r = −0.71) between individual PCA1 scores and WDStu (Table 1 and Fig. S1A). This correlation was also observed at the species level using species-level WD obtained from a Global Wood Density database13,44 (WDGWD, r = −0.65, Table 1 and Fig. S1B). This relationship is similar to that previously reported by Hietz et al.37 in the case of radial WD gradients [Panamanian moist forest and Ecuadorian rain forest, 304 species] and Sagang et al.41 for vertical gradients [semideciduous forest of Cameroon, 15 species]. We observed a shift in the vertical WD profile from decreasing (negative PCA1 scores) to increasing (positive PCA1 scores) as species WDGWD decreased (vertical dashed lines in insets in Fig. 1A). The second PCA axis was correlated with tree structure variables (Table 1, Fig. 1B). We leveraged these correlations to derive models allowing us to predict and account for vertical WD gradients (see Table 2).
Taxonomic, geographical and functional grouping
Using PCA scores to describe the relative vertical profiles in the WD of individual trees, we examined whether these profiles were clustered taxonomically, geographically or functionally. This is indeed of fundamental importance to understand the possible adaptive meaning of the profiles as well as their effect on AGB estimation bias at the stand or regional level (if similar profiles tend to be clustered at these scales).
Individual trees from the same species showed consistent relative vertical profiles in WD. For instance, 81.1% of trees exhibited the same sign along PCA1 as their species average. Similarly, 88% of the individuals presented the same sign as their species average for the difference between the tree stump and small branches. Our dataset includes only two genera with more than one sampled species, so we could not evaluate profile aggregation at the genus level. However, we found clear taxonomic overdispersion of tree PCA1 scores at the family level (KBlomberg = 0.132, P = 0.014, see methods), suggesting less similarity than expected by chance at the family (i.e., strong interfamily variation) or higher taxonomic level. This finding is consistent with the phylogenetic aggregation patterns reported for WD, with decreasing similarity in WD from species to genus and low similarity in WD at the family level26,45.
The tree sampling site had little influence on the relative vertical profile in WD. We used ANOVA to partition the variance of tree PCA1 scores between species, sampling sites and their interaction. Since many species were found at one or two sampling sites only (28 and 14 species, respectively), we restricted the analysis to species found in at least three sites (representing a total of 330 trees from 9 species). The species effect captured 44% of the variance (F = 32.12, P < 0.001), but both the main site effect (1.8% of the variance, F = 2.20, P = 0.056) and its interaction with species (5.9% of the variance, F = 60.6, P = 0.056) were non-significant. In other words, the interspecific variation in WD vertical profiles is much greater than the site effect on a given species’ profile.
At the community level, the abundance of decreasing, stable and increasing profiles within the community is likely to change over broad regional extents given the known patterns of mean (community-level) WD variation13. The mean community vertical WD profile will also vary at the landscape scale following the history of forest perturbations. Grouping species into (a priori) regeneration guilds46 (Suppl. Table 1) indeed distinguished pioneer species (P) from nonpioneer light-demanding (NPLD) and shade-tolerant (ST) species, particularly along PCA1 (F = 32.5, P < 0.001, Fig. 1C). Pioneer species characterized by light wood tended to exhibit increasing relative vertical WD profiles, whereas (dense wood) shade-tolerant species exhibited decreasing relative vertical profiles. NPLD species presented intermediate scores and, hence, less contrasting profiles. This result, coupled with existing knowledge on radial WD variation in the trunk, highlights clear homology between radial and vertical WD variations and their relations to plant strategies37. Across the 51 studied species, the differences in species average WD were highest at the tree base and decreased toward the small branches (Fig. 1E). The broader range of species WD found at the trunk base may reflect differences in canopy accession strategies in early tree developmental stages17. We can think about radial and vertical WD increases in light of the costs and benefits of investing in low vs high WD. For a given biomass investment, theory predicts that building a thicker trunk with a low WD is more efficient for carrying a tree’s own weight (resistance to buckling) and resisting wind forces than building a thinner trunk with a high WD47,48. Although low-WD stems require less biomass investment per unit stem volume48, they imply higher maintenance costs of living tissues (inner bark and wood parenchyma)49, suggesting that WD may eventually have to increase (both upward and outward) in older pioneer trees. Narrow stems with a relatively higher WD in young shade-tolerant trees may allow greater resistance against falling branches from dominant trees26,45. This investment in dense wood might not be needed later in the ST tree life, which could then produce lighter outer wood. The decreasing outward WD gradient can then be reinforced during heartwood formation35. In mature, reiterated tree crowns, on the other hand, most trees reaching the canopy will tend to be subjected to similar biomechanical constraints when extending branches laterally. This may explain why WD then converges to a narrower range of values across all the sampled species. In other words, whereas contrasted strategies exist in early life stages, there seem to be a convergence in the mechanical or maintenance constraints met by adult trees, which is reflected by similar wood densities across species both in the branches (vertical gradients) in in the outer wood (radial gradients). This result is also congruent with the fact that large reiterated trees tend to display similar forms50, independent of discrepancies in the architectural model49 observed at the sapling stage.
Influence of vertical variation in WD on tree AGB estimates
We leveraged volumes estimates from both (i) the 822 destructively sampled individuals and (ii) terrestrial LiDAR scanning data for a subset of 58 individual trees10.
Using species WDGWD to convert volumes to masses in our 822 sampled trees, we found a positive mean error across all trees (B = 8.12% ± 17.20%) with large individual variations (i.e., tree-level errors, bi, ranging from −40.31% to +72.77%; back line in Fig. 2A) and a coefficient of variation (CV) of 30.9%. Using WDStu, we obtained a similar mean error across all trees (B = 8.97% ± 11.08%), with a narrower range of individual errors (from −24.05% to 61.69% and CV = 19.8%, Fig. S3A). We found similar error patterns when tree volumes were derived from terrestrial LiDAR data based on 58 scanned trees (see red line in Fig. 2A). The error in individual tree AGB estimation (bi) was correlated with the tree vertical WD profile (Figs. 2B and S3B). This resulted in (i) overestimation of AGB (positive bi) for trees with negative PCA1 scores (i.e., decrease in WD from the stump to small branches) and (ii) underestimation of AGB (negative bi) for trees with positive PCA1 scores (i.e., increase in WD from the stump to small branches), regardless of the WD source (i.e., WDGWD or individual WDStu). It is worth noting that vertical variation in WD may also affect the accuracy of AGB allometric models. For instance, we observed a similar pattern of error on AGB estimations obtained from a pantropical model4, with a decrease in mean tree error as PCA1 score increased (Fig. S5). This suggests that within-tree WD variation is not well accounted for even in reference pantropical allometric models.
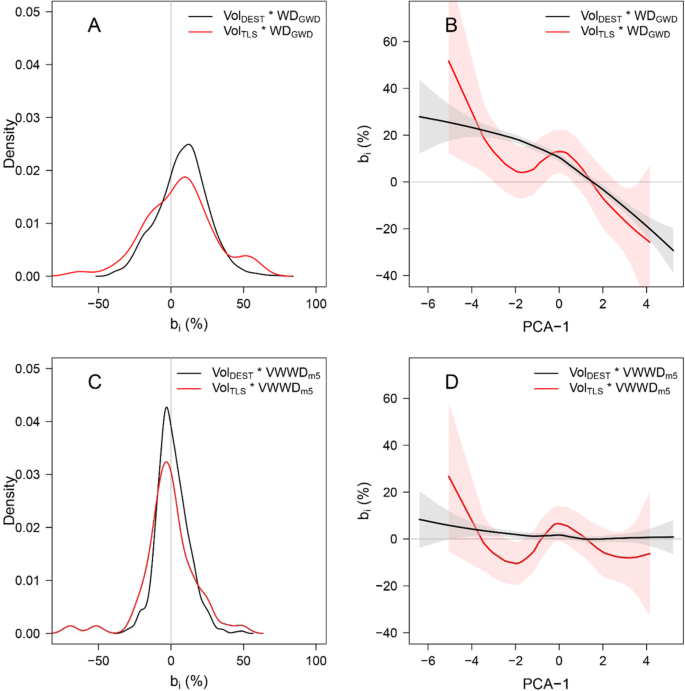
Bias in volume to mass conversion due to vertical WD gradients induced by the use of WDGWD: (A) Density plot of the relative errors (bi) in tree biomass estimation computed from combinations of tree volume (destructive data: black line, n = 822; LiDAR data: red line, n = 58) and species mean wood density extracted from the Global Wood Density database (WDGWD). (B) Local regression (loess function) representing the relationship between tree relative vertical WD profile (characterized by tree PCA1 score) and bi of panel A. Bias is reduced when using a tree-level estimate of WD, the volume-weighted wood density (VWWDm5): (C) Density plot of bi for tree biomass estimation computed from combinations of tree volume and the predicted VWWD from WDGWD and tree DBH (model 5, see Table 2). (D) Local regression (loess function) representing the relationship between the relative vertical WD profile and bi of panel C.
The implications for stand-level error propagation in AGB estimation were not specifically studied here, but decreasing vertical variation in WD tended to be more frequent, explaining the overall mean positive bias obtained across our destructive (c. 9%) and terrestrial LiDAR (c. 11%) datasets and the 9% overestimation at the stand level found by Sagang et al.41 with a subset of our data. Since the vertical profile is correlated with species mean WD, and the latter value is close to 0.6 g cm−3 in wet tropical forests overall44, we may expect dominance of decreasing vertical WD patterns (see Fig. 1D) in this ecosystem. However, this may not be the case in young secondary rainforests, where the abundance of pioneer species may cancel out or even invert vertical WD patterns at the stand level. The successional trend may be different in drier vegetation, where early successional species exhibit relatively denser wood, possibly to resist higher stress levels51. This potential scenario has implications when estimating stand-level carbon content (emission factor) using volumetric data12, notably in the context of national forest or greenhouse gas inventories. We indeed expect the bias in AGB estimation to be strongly structured in space, varying with the species distribution and forest disturbance history.
Predicting and correcting vertical WD variations
Reducing systematic errors in AGB estimations when converting tree volumes to masses requires the use of WD values that are representative of tree-level wood density, which involves integrating vertical variation in WD. For each tree, we weighted each compartment’s WD by its volume to calculate the compartment volume-weighted WD, which were summed to obtain the tree level VWWD (see Methods). We then developed linear prediction models for VWWD using easily accessible variables characterizing WD (i.e., WDStu, WDGWD) and tree structure (tree DBH and the stem morphology index, Sm, used in Sagang et al.41). Prediction models based on WD alone explained most of the variance in tree VWWD (R² = 0.87 for m1 based on WDStu and 0.78 for m4 based on species average WDGWD, Table 2). Bias in tree AGB estimations was considerably reduced when using VWWD predicted from m1 and m4 to convert tree volume to mass (B = 0.86% and 1.41% for m1 and m4, respectively). Including tree DBH in VWWD models further increased the model fit (∆AIC = −103.2 and −120.3 for m2 and m5 in comparison to m1 and m4, respectively) and reduced the bias in tree AGB estimates (B = 0.75% and 1.19% for m2 and m5, respectively; Figs. S3C,D and 2C,D). Although several other tree structure predictors were significant (e.g., stem morphology index Sm in m3 and m6), they often led to modest improvements of model fit (for instance, ∆AIC = −26.7 and −18 for m3 and m6 with respect to m2 and m5, respectively). We therefore favor using models m2 or m5, depending on the availability of local WD data.
We evaluated the robustness of our models using a leave-one-out cross-validation procedure, where the models were calibrated on all sites except a focal site (corresponding to a country in this case) and were used to predict tree VWWD for that site. Overall, the cross-validation models proved robust with B < 5% and CVs only slightly higher than when focal sites were used in model calibration (Fig. S4). This suggests that WD correction models should be transposable to other sites.
The role of intraindividual WD gradients had not previously been evaluated when applying terrestrial LiDAR scanning to estimate AGB. The existing studies either exhibited unexplained systematic bias10,52 or neglected the influence of vertical WD variations by using WD obtained from the Global Wood Density database in both predicted and reference AGB data52. In this study, we showed that WD gradients were a large source of uncertainty in tree-level AGB estimations and that they propagated systematic errors (bias) across our datasets that were far from being negligible (c. 10%). As TLS technology will likely play an increasing role in the development of nondestructive AGB allometries10,11,52 and the direct assessment of AGB at the stand level (notably for the calibration of upcoming satellite sensors53), care should be taken not to let the gain in the precision of wood volume be offset by the use of biased WD estimates. Here, we followed and generalized a seminal study39,41 in which the approach differed significantly from previous approaches45,46 in proposing to collect WD samples at specific locations in trees that would presumably be representative of the mean tree WD. Instead, we leveraged the relationships between WD estimates that are currently available (e.g., from the Global Wood Density database), WD vertical variation patterns and data that are routinely collected during field inventories to develop correction models that can easily be implemented for standard scientific inventory data. These models substantially reduced the error of tree-level AGB estimations and virtually removed the bias across our datasets, and they therefore constitute an efficient solution to the challenges of estimating tree biomass from volumetric data.
The results presented here provide a unique perspective on the homology between radial and vertical WD gradients, on the spectrum of regeneration and survival strategies in young stages, and on the converging biomechanical constraints in the canopy of reiterated trees. These findings should guide the collection of further biomechanical50 and physiological information required to improve our functional understanding of dense tropical forests. Our findings will also contribute to the development of nondestructive, precise and accurate methodologies for biomass assessment in tropical forests, with concrete implications for national greenhouse gas accounting, carbon trading schemes and REDD + frameworks in tropical countries.
Source: Ecology - nature.com
