Nitrite and ammonia oxidation in the Northern GoM
Nitrite and ammonia oxidation rates were determined during an East–West sampling transect on the Louisiana Shelf of the GoM in July 2016 (Supplementary Fig. 2). Due to summertime eutrophic conditions32, bottom waters were hypoxic at the time (<63 µM oxygen, max. water depth at the sampled stations was 18.5 m). Hypoxic bottom waters generally coincided with highest median ammonium (320 nM), urea (69 nM), cyanate (11.5 nM), nitrite (848 nM) and nitrate (2250 nM) concentrations31 (Fig. 1a–c, Supplementary Fig. 3). These concentrations are similar to previous observations18.
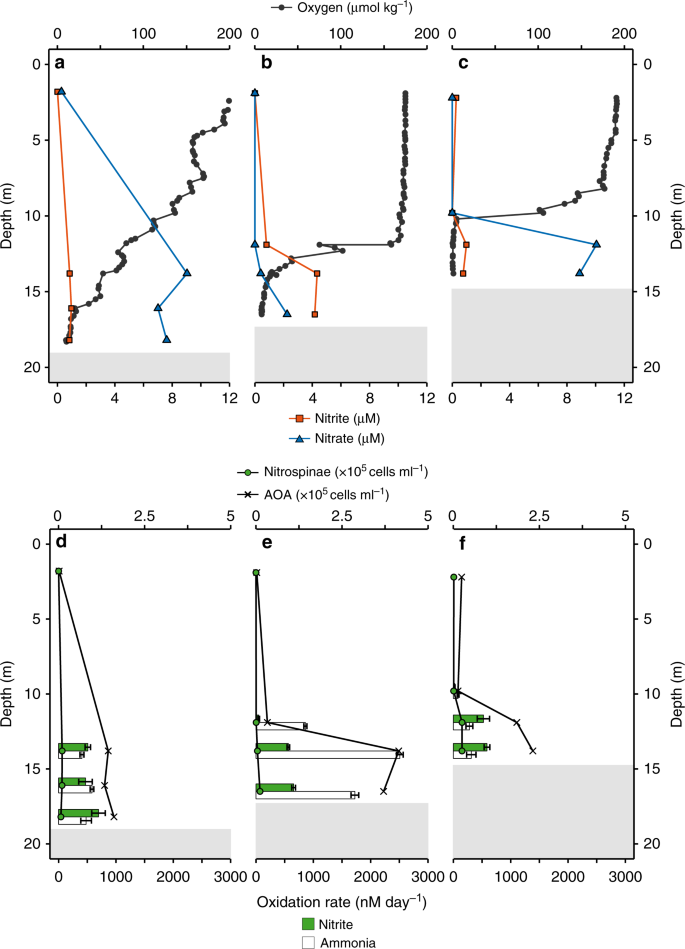
a–c In situ oxygen, nitrite and nitrate concentration profiles at Station 1 (a), Station 2 (b), and Station 3 (c). d–f Nitrite and ammonia oxidation rates and Nitrospinae and AOA CARD-FISH counts at Station 1 (d), Station 2 (e), and Station 3 (f). Nitrite and ammonia oxidation rates are depicted as green and white bars, respectively, and were calculated from slopes across all time points of triplicate incubations. Error bars represent standard error of the slope. Surface nitrite and nitrate concentrations (a–c) as well as CARD-FISH counts (d–f), were taken from the same station, the day before stable isotope labelling experiments were carried out. Shaded gray areas indicate sediment (max. water depth was 18.5 m) (see also Supplementary Fig. 7).
Nitrite and ammonia oxidation rates were in a similar range, with rates between 25 and 700 nM day−1 for nitrite oxidation and 80–2500 nM day−1 for ammonia oxidation31 (Fig. 1d–f). Nitrite oxidation rates were in the range of the few rates that have been reported previously from the GoM18 and other oxygen deficient waters3,8,9,19. There was no clear relationship between nitrite and ammonia oxidation rates in the GoM (Supplementary Fig. 4). For example, ammonia oxidation outpaced nitrite oxidation rates at Station 2, whereas at Station 3, nitrite oxidation rates were higher than ammonia oxidation rates at 12 m and 14 m depth (Fig. 1e, f). This suggests that nitrite and ammonia oxidation at individual stations and depths are not tightly linked, which is in line with previous observations in the GoM18 and most likely can be attributed to the dynamic conditions in this region18. The local decoupling of nitrite and ammonia oxidation in the GOM provides a unique opportunity to study both processes independently. There was no correlation between the nitrite oxidation rates and nitrite concentration (Fig. 2a); however, there was a significant positive correlation between ammonia oxidation rates and nitrite concentrations31 (Fig. 2b). This indicates that in the GoM, as in most of the ocean, ammonia oxidation, rather than nitrate reduction to nitrite, was the main source of nitrite3.
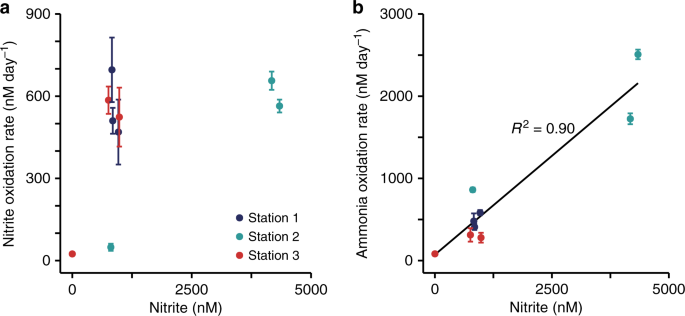
a Correlation between nitrite oxidation rate and nitrite concentration. b Correlation between ammonia oxidation rate and nitrite concentration (reproduced from ref. 31). The black line is the linear regression, R2 was calculated on the basis of Pearson correlations, and was significant (two-sided t-test, t = 8.002, DF = 7, P = 9.10 × 10⁻⁵). Error bars represent standard error of the process rates calculated from slopes across all time points and replicates.
Nitrite oxidizing community; composition and abundance
To identify the NOB responsible for nitrite oxidation in the GoM, 16S rRNA gene amplicon and deep metagenomic sequencing were performed, and in situ metatranscriptomes were obtained. The only detectable known NOB based on 16S rRNA gene sequences in both amplicon and metagenomic datasets belonged to the phylum Nitrospinae (Fig. 3). Nitrococcus, another marine NOB that is frequently found in shelf areas23, was not detected in our dataset. The metagenomes and metatranscriptomes were screened for the presence and transcription of the alpha subunit of nitrite oxidoreductase (nxrA), a key gene for nitrite oxidation. In line with the 16S rRNA gene results, almost all (84–98%) identified metagenomic nxrA fragments were affiliated with Nitrospinae (Supplementary Fig. 5). A further 2–15% of the metagenomic read fragments mapped to nxrA of the NOB genus Nitrolancea33. However, only the nxrA genes of Nitrospinae were detected in the metatranscriptomics datasets (Supplementary Fig. 5).
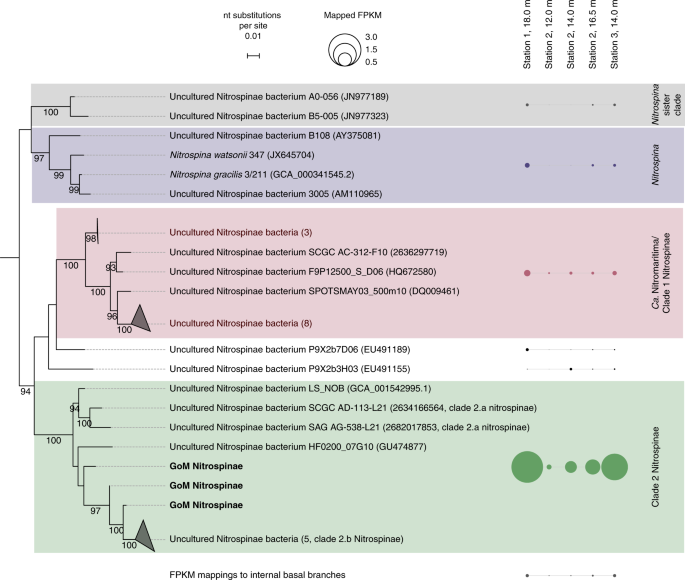
Nitrospinae 16S rRNA gene sequences retrieved from GoM metagenomes are indicated as “GoM Nitrospinae” and printed in bold Outgroup sequences represent cultured Deltaproteobacteria. GoM metagenomic read fragments (FPKM) were mapped onto the alignment and are shown next to the respective clades as circles. FPKM mapping to internal basal nodes were grouped and are displayed separately. The scale bar represents estimated nucleotide substitutions per site, and bootstrap values >90% are displayed.
Based on the retrieved metagenomic Nitrospinae 16S rRNA gene reads, several co-occurring Nitrospinae were identified: 85–94% of the metagenomic Nitrospinae 16S rRNA reads were affiliated with Nitrospinae Clade 2, 2–11% were affiliated with “Ca. Nitromaritima” (Nitrospinae Clade 1), and 0.1–2% were affiliated with the genus Nitrospina11,22 (Fig. 3). Members of Nitrospinae Clade 2, the most abundant Nitrospinae in our dataset, are environmentally widespread and have previously been detected in metagenomes from open ocean waters, oxygen minimum zones and the seasonally anoxic Saanich inlet11,27. Additionally, our analyses of 16S rRNA gene sequences from global amplicon sequencing data sets (sequence read archive, SRA) revealed that phylotypes closely related (>99% identity34) to GoM Nitrospinae Clade 2 occur worldwide in temperate and tropical ocean waters (Supplementary Fig. 6).
To constrain absolute nitrite oxidizer cell numbers, in situ cell counts were performed by catalyzed reporter deposition fluorescence in situ hybridization (CARD-FISH) using specific probes for Nitrococcus35, Nitrospira36, and Nitrobacter37. We designed a new Nitrospinae-specific probe (Ntspn759), as the published Nitrospinae probes (Ntspn693 (ref. 35) and the recently published probe Ntspn-Mod11) covered only a fraction of the known Nitrospinae, and did not cover all sequences in our dataset. The newly developed Ntspn759 probe targeted all of the obtained GoM Nitrospinae 16S rRNA gene sequences and 91% of the known 16S rRNA gene diversity of the family Nitrospinaceae, which contains all known Nitrospinae NOB (Supplementary Methods). The only NOB in the GoM detectable by CARD-FISH were Nitrospinae, which is in line with the observations from amplicon and metagenomic sequencing that Nitrospinae were the main NOB.
Nitrospinae were hardly detectable by CARD-FISH in the surface waters, and numbers increased with depth, reaching up to 2.8 × 10⁴ cells ml−1 just above the sediment. Based on CARD-FISH counts, Nitrospinae constituted at most 1% of the microbial community at all depths and stations (Fig. 1, Supplementary Fig. 7). Nitrospinae CARD-FISH counts were an order of magnitude lower than those of the only detectable ammonia oxidizers, the AOA, in the same samples (using probe Thaum726)31,38,39 (Fig. 1, Supplementary Fig. 8a). A similar difference in abundance between these two nitrifier groups was also seen in the 16S rRNA gene amplicon dataset and the abundance of Nitrospinae and AOA metagenome assembled genomes (MAGs)31 (Supplementary Fig. 8b, c).
The lower abundance of NOB compared to AOA in marine systems has been observed before in metagenome, amplicon, and qPCR-based studies10,12,13,40,41,42. Our results confirm this trend using CARD-FISH, a more direct quantification method that is independent of DNA extraction and primer biases. In addition to the in situ Nitrospinae and AOA31 counts, CARD-FISH counts were carried out at the end of the 15N and 13C incubations, which revealed that in some incubations, Nitrospinae and AOA abundances increased (up to five- and six-fold, respectively) within the incubation period of 24 h (Supplementary Data 1).
Per cell nitrite and ammonia oxidation rates
The per cell nitrite oxidation rate may play a key role in determining the abundance of NOB in the environment, as this rate largely determines the energy that can be gained at a single cell level. Such values have not been reported before for marine NOB, as absolute NOB cell numbers are rarely quantified at the same time as bulk nitrite oxidation rates. In fact, per cell nitrite oxidation rates have not been reported even for pure Nitrospina cultures. As the Nitrospinae were the only significant known NOB in the GoM, we were able to calculate per cell nitrite oxidation rates by assuming that all of the Nitrospinae detected by CARD-FISH were active (which is in line with our nanoSIMS data, see below). Average CARD-FISH cell counts between the start and the end of the incubations were combined with the bulk nitrite oxidation rates (Supplementary Data 1) to calculate per cell nitrite oxidation rates, which ranged from 21 to 106 fmol per cell per day. These rates were ~15-fold higher than the per cell ammonia oxidation rates of the AOA from the same samples (1–8 fmol-N cell−1 day−1)31 (see Methods). These per cell nitrite oxidation rates are in line with those that can be estimated by combining qPCR data for Nitrospinae 16S rRNA gene abundance and bulk nitrite oxidation rates from the Eastern tropical North Pacific9, where Nitrospinae also dominate the NOB community. Those rates ranged from 0 to 107 fmol nitrite per cell per day, assuming that Nitrospinae from the Eastern tropical North Pacific, like N. gracilis28, have a single rRNA operon.
The success of NOB in oxygen deficient waters has, amongst other factors, been attributed to a high affinity for oxygen19,43. Our incubations were carried out at in situ oxygen concentrations, ranging from 1 to 160 µM. There was no correlation between Nitrospinae per cell nitrite oxidation rates and oxygen concentrations (Supplementary Fig. 9). This indicates that the nitrite oxidizers in the GoM were never oxygen limited, but are well adapted to low oxygen concentrations, as observed previously in other regions19,43.
Cellular carbon content of Nitrospinae and AOA
Despite their low abundance, Nitrospinae have recently been estimated to be responsible for more dark carbon (C) fixation in marine systems than the highly abundant AOA11. This could imply that the bulk population C-content of the Nitrospinae is higher than the bulk population C-content of the AOA. Previous studies indicate that Nitrospinae cells are larger than AOA cells5,11,15, but the differences in cell and population size have never been quantified in situ and subsequently converted to cellular or population C-content. In order to quantify the C-content of the NOB and AOA populations in the GoM, cell volumes were calculated from nanoscale secondary ion mass spectrometry (nanoSIMS) measurements. The GoM Nitrospinae were on average four-fold larger in volume than the AOA. This is in contrast to previous estimates by Pachiadaki et al.11, who reported Nitrospinae cells to be 50-fold larger than AOA cells. However, their calculations were based on cell diameter estimates obtained from flow cytometry and assumed spherical cell shapes, whereas in the GoM and in culture, AOA resemble rods or prolate spheres and Nitrospinae cells are curved rods5,15,16,26. By applying a scaling factor for C-content based on cell biovolume44, we calculated that the GoM Nitrospinae contained approximately two times as much C per cell (100 ± 23 (SD) fg-C cell−1) as AOA (50 ± 16 (SD) fg-C cell−1, Table 1). The AOA in the GoM were visibly larger (length × width = 0.6 ± 0.1 (SD) × 0.4 ± 0.1 (SD) µm) than many cultured marine AOA5,44,45,46 (length × width = 0.5–2 × 0.15–0.26 µm) and those normally observed in environmental studies. As such, the GoM AOA cellular C-content was higher than previously determined, ranging from 9 to 17 fg-C cell−1 (refs 44,46,47,48).
By combining the in situ Nitrospinae and AOA cell abundances and their per cell C-content, the bulk C-content of both nitrifier populations was estimated. The C-content at all investigated stations and depths ranged from 0.06 to 2.52 bulk-µg-C L−1 for the Nitrospinae population and 0.67–20.75 bulk-µg-C L−1 for the AOA population. Thus, the overall Nitrospinae population C-content was ~10-fold lower than that of the AOA population.
In situ growth rates of Nitrospinae and AOA
In situ growth rates for Nitrospinae have not been reported so far. NanoSIMS was performed on samples from Station 2, 14 m depth, which were amended with 13C-bicarbonate and 15N-ammonium (or 15N-nitrite, see Methods) to determine single cell Nitrospinae growth rates. Autotrophic growth rates from C-fixation were 0.25 ± 0.01 (SE) day−1 and ammonium-based growth rates were 0.53 ± 0.03 (SE) day−1 (Fig. 4), corresponding to doubling times of 2.8 and 1.3 days, respectively. The discrepancy between C- and N-based growth may be partly due to C isotope dilution by the CARD-FISH procedure49,50. The dilution of Nitrospinae cellular carbon by 12C-derived from the polycarbonate filters might also have affected the measured single cell 13C-uptake rates (see Methods). Additionally, the discrepancy between C- and N-based growth could indicate that the Nitrospinae use intracellular C-storage compounds to support growth or were growing mixotrophically, for which there was some evidence in the Nitrospinae MAGs (see below).
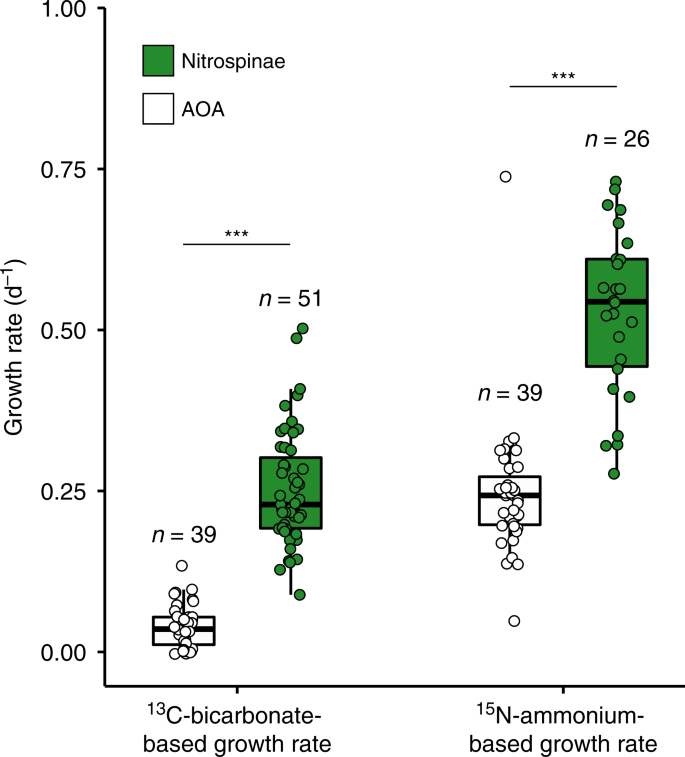
Nitrospinae 13C-bicarbonate assimilation rates were determined from water samples after the addition of 15N-ammonium and 13C-bicarbonate, and 15N-nitrite and 13C-bicarbonate. AOA data were acquired from the incubation with added 15N-ammonium and 13C-bicarbonate only and were taken from Kitzinger et al.31. Number of cells analyzed per population is indicated above each boxplot. Boxplots depict the 25–75% quantile range, with the center line depicting the median (50% quantile); whiskers encompass data points within 1.5x the interquartile range. Data of each measured cell are shown as points; horizontal position was randomized for better visibility of individual data points. Nitrospinae had significantly higher growth rates than AOA, as indicated by stars (one-sided, two-sample Wilcoxon test, W = 1984, p = 4.04 × 10⁻¹⁶ for growth based on 13C-bicarbonate assimilation and W = 1464, p = 3.32 × 10⁻¹² for growth based on 15N-ammonium assimilation).
Compared to the Nitrospinae, the AOA in the GoM had significantly lower growth rates based on both 13C-bicarbonate assimilation (0.04 ± 0.005 (SE) day−1) and 15N-ammonium assimilation (0.23 ± 0.01 (SE) day−1)31 (Fig. 4). It should be noted that the lower measured AOA autotrophic (13C-based) growth rates may also be affected by the smaller cell size of AOA in comparison to Nitrospinae, which likely leads to a stronger C-isotope dilution effect due to 12C-derived from the polycarbonate filters (see Methods). The measured lower growth rates of AOA compared to Nitrospinae were, however, also in good agreement with substantially lower per cell oxidation rates of AOA compared to Nitrospinae.
In situ organic N use by Nitrospinae
Intriguingly, the ammonium-based growth rate (0.5 day−1) of the Nitrospinae was substantially lower than that calculated from the increase in cell numbers during the incubation period, which corresponded to a growth rate of 1.2 day−1 (0.6 days doubling time). This indicates that the Nitrospinae may have been assimilating N-sources other than ammonium. Metagenomic studies and analysis of the N. gracilis genome have indicated that some Nitrospinae can use the simple dissolved organic N-compounds (DON) urea and cyanate as additional N-sources11,22,27,28,29. To assess whether this is the case in the environment, single cell N-assimilation based on the incorporation of 15N-ammonium, 15N-urea, 15N-cyanate, and 15N-nitrite was determined by nanoSIMS.
All measured Nitrospinae cells were significantly enriched in 15N for all tested substrates (Fig. 5). Furthermore, the Nitrospinae assimilated significantly more 15N from all these compounds than surrounding microorganisms, including the AOA31. Intriguingly, ammonium and urea were assimilated equally by Nitrospinae, followed by cyanate. Nitrite assimilation by Nitrospinae was much lower compared to the other tested substrates. We calculated the growth rates of Nitrospinae and AOA from N-assimilation of all tested substrates combined (Supplementary Fig. 10). The combined N-based growth rate was 1.2 day−1 for Nitrospinae and 0.26 day−1 for AOA, which agrees well with cell count based growth rates of 1.2 day−1 and 0.25 day−1 for Nitrospinae and AOA, respectively (determined at Station 2, 14 m depth). This implies that GoM Nitrospinae and AOA could meet all of their cellular N-demand by using ammonium, urea and cyanate. In fact, when taken together, urea, and cyanate assimilation met more than half of the Nitrospinae cellular N-demand, while AOA mainly assimilated ammonium. Utilization of DON for N-assimilation is likely a key factor for the ecological success of Nitrospinae, as it allows them to avoid competition with AOA, whom they depend on for their substrate, nitrite. The use of reduced DON (or ammonium) is also favored over nitrite because six reducing equivalents are required to reduce nitrite to ammonium before assimilation, which is metabolically costly. Thus, from an ecophysiological perspective, utilization of DON as N-source by Nitrospinae is highly advantageous.
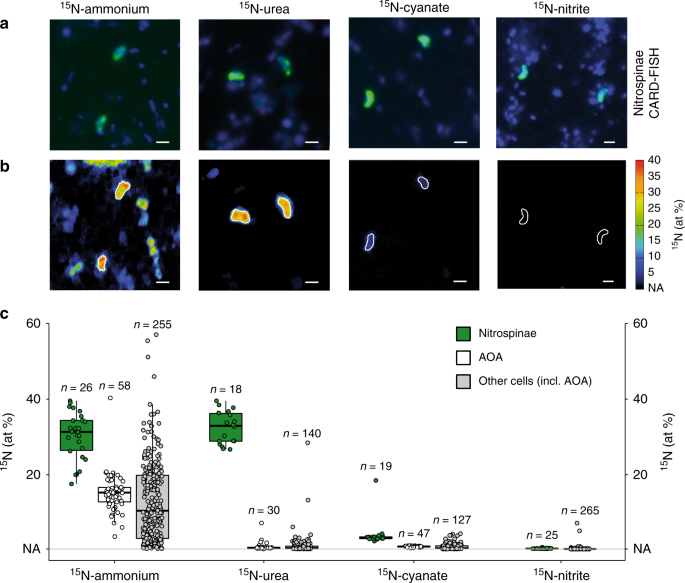
a Representative CARD-FISH images of Nitrospinae (green, stained by probe Ntspn759) and other cells (blue, stained by DAPI). b Corresponding nanoSIMS image of 15N at% enrichment after addition of 15N-ammonium, urea, cyanate or nitrite. Nitrospinae are marked by white outlines. Scale bar is 1 μm in all images. c 15N at% enrichment of Nitrospinae (green), AOA (white) and other, non-targeted cells (gray) after incubation with 15N-ammonium, 15N-urea, 15N-cyanate or 15N-nitrite. AOA data were taken from Kitzinger et al.31 for comparison. Note that non-targeted cells depicted here also include AOA cells, as no specific AOA probe was included in the Nitrospinae nanoSIMS measurements. Number of cells analyzed per category is indicated above each boxplot. Boxplots depict the 25–75% quantile range, with the center line depicting the median (50% quantile); whiskers encompass data points within 1.5x the interquartile range. NA is the natural abundance 15N at% enrichment value (0.37%).
Nitrospinae MAG analyses
To assess the genomic basis for DON utilization by Nitrospinae, we screened the GoM metagenomes for the presence and transcription of Nitrospinae-like cyanase and urease genes. From five deeply sequenced metagenomes, we obtained seven Nitrospinae MAGs, representing three closely related Nitrospinae population clusters (hereafter referred to as population cluster A, B, and C). Nitrospinae population cluster A made up 0.003–0.358% and population cluster B 0.008–0.152% of the metagenomic reads, compared to the lower abundance population cluster C with 0.003–0.050% (Supplementary Table 1). All obtained MAGs were affiliated with Nitrospinae Clade 2 (Fig. 1, Supplementary Fig. 1). In line with the observed assimilation of 15N from 15N-ammonium and 15N-nitrite, the MAGs contained both ammonium and nitrite transporters, as well as assimilatory nitrite reductase genes (Supplementary Table 2). The nanoSIMS data implied that all measured Nitrospinae are capable of urea and cyanate assimilation. Accordingly, at least one MAG representative of each population cluster A, B and C contained urease and/or urea ABC-transporter genes, supporting the observed in situ assimilation of urea-derived N (Supplementary Table 2). Nitrospinae-affiliated urease genes were also transcribed in the GoM (Supplementary Fig. 11). Metagenomic read fragment abundance (FPKM) of Nitrospinae-affiliated ureC genes was very similar to FPKM values of Nitrospinae 16S rRNA (SSU) and rpoB gene abundance in all metagenome datasets (average FPKMureC: FPKMSSU = 1.2, FPKMureC: FPKMrpoB = 1.7), indicating that all GoM Nitrospinae encoded ureC. In contrast, clearly Nitrospinae-affiliated cyanase (cynS) genes were much less abundant in the metagenome datasets (average FPKMcynS: FPKMSSU = 0.09, FPKMcynS: FPKMrpoB = 0.1). In fact, only one of the MAGs (population cluster B) contained the cynS gene (Supplementary Table 2); and its transcription was not detected in the metatranscriptomes (Supplementary Fig. 12). This contrasts with the obtained nanoSIMS data, where all measured Nitrospinae incorporated N from cyanate. The reason for this discrepancy is unknown. However, as cynS has previously been shown to undergo horizontal gene transfer29,51, it is possible that GoM Nitrospinae contain additional cyanases not closely related to previously known Nitrospinae cynS genes31.
In addition to urea and cyanate utilization genes, the MAGs also encoded for spermidine, amino acid and (oligo-) peptide ABC-type transporters, which may provide additional N- and C-sources for growth. The presence of a sugar transport system likely taking up sucrose, a fumarate/malate/succinate transporter, as well as many uncharacterized ABC transporter systems further indicated that the GoM Nitrospinae have a potential for mixotrophic growth (Supplementary Table 2). Mixotrophic growth of GoM Nitrospinae might contribute to the differences observed in 13C-bicarbonate and 15N-based growth rates and may contribute to their high measured growth rates and environmental success.
The Nitrospinae MAGs provided little evidence for alternative chemolithautotrophic energy generation pathways, which is in good agreement with recent findings from other oxygen deficient waters27. As in all other sequenced nitrite oxidizers, including N. gracilis28, the Nitrospinae MAGs encoded a copper containing nitrite reductase (nirK). Furthermore, the MAG with the lowest abundance encoded a putative NiFe 3b hydrogenase, similar to the one found in the genome of N. gracilis28. Overall, the potential for known alternative energy generating pathways was low in the obtained MAGs of Nitrospinae Clade 2. However, it cannot be excluded that Ca. Nitromaritima (Nitrospinae Clade 1) and Nitrospina, which also occur in the GoM at lower abundance, and for which no MAGs were obtained, do have additional metabolic versatility.
In situ N- and C-assimilation rates of Nitrospinae and AOA
Single cell and population N- and C-assimilation rates were calculated for Nitrospinae and AOA using the 15N-enrichment and their cellular N-content as calculated from their biovolumes (see Methods). Average Nitrospinae N-assimilation in fmol-N per cell per day was 0.42 ± 0.03 (SE) for 15N-ammonium, 0.43 ± 0.02 (SE) for 15N-urea, 0.05 ± 0.01 (SE) for 15N-cyanate and 0.003 ± 0.0004 (SE) for 15N-nitrite. Thus, the combined Nitrospinae N-assimilation from all 15N-substrates together was 0.91 fmol-N per cell per day. In comparison to Nitrospinae, the single cell N-assimilation rates (in fmol-N per cell per day) of AOA were significantly lower, with 0.11 ± 0.01 (SE) for 15N-ammonium, 0.005 ± 0.001 (SE) for 15N-urea, 0.004 ± 0.0002 (SE) for 15N-cyanate; and the combined AOA N-assimilation rate from all 15N-substrates together was 0.12 fmol-N per cell per day.
Due to the probable bias in measured 13C-enrichment measurements (see above), C-assimilation for both Nitrospinae and AOA was estimated from the measured 15N-assimilation rates, following the Redfield ratio of C:N (6.6:1, see Methods). The combined Nitrospinae C-assimilation rate was 6.0 fmol-C per cell per day, compared to a much lower combined AOA C-assimilation rate of 0.76 fmol-C per cell per day. When these values were combined with the Nitrospinae and AOA cell counts, the population C-assimilation was ~80 nmol-C per liter per day for the Nitrospinae and ~400 nmol-C per liter per day for the AOA. Nitrospinae and AOA C-assimilation was also calculated from the increase in cell counts before and after incubation and their cellular C-content. The C-assimilation rate based on cell count increase was ~75 nmol-C per liter per day for the Nitrospinae population, and ~480 nmol-C per liter per day for AOA; these values are similar to those calculated from the 15N-tracer additions.
Contrasting life strategies of Nitrospinae and AOA
From a thermodynamic perspective, nitrite oxidation is a much less exergonic process than ammonia oxidation14. This is also the case under conditions representative for the GoM, where Gibbs free energy release is −65 kJ per mol for nitrite oxidation, compared to −262 kJ per mol for ammonia oxidation (Supplementary Table 3). Based on the measured bulk nitrite and ammonia oxidation rates at Station 2, 14 m depth (Fig. 1), nitrite oxidation provides ~0.04 Joule per liter per day, and ammonia oxidation ~0.7 Joule per liter per day in the hypoxic GoM waters. Therefore, from a purely thermodynamic perspective, AOA biomass should increase about ten times faster than that of the Nitrospinae in the GoM (Fig. 1). This, however, assumes that they have an equal biomass yield (i.e. they are fixing the same amount of C per Joule, see below), which likely is not the case52. The Joule energy gain was combined with the population C-assimilation rates of ~80 nmol-C per liter per day for the Nitrospinae, and ~400 nmol-C per liter per day for the AOA population (Table 1) to calculate the biomass yield for nitrite and ammonia oxidation (i.e. nmol-C fixed per Joule gained). Intriguingly, the biomass yield for the Nitrospinae population was ~2150 nmol-C per Joule, while AOA population biomass yield was only ~610 nmol-C per Joule (Table 1). This implies that Nitrospinae are ~4-fold more efficient in translating the energy gained from the oxidation of nitrite to C-assimilation than the AOA are in translating energy gained from ammonia oxidation. This is surprising considering that AOA use the HP/HB C-fixation pathway, which is suggested to be the most energy efficient aerobic autotrophic C-fixation pathway (requiring five ATP per generated pyruvate53). Nitrospinae employ the reverse tricarboxylic acid cycle (rTCA) for autotrophic C-fixation28. This pathway is highly energy efficient under anaerobic conditions (requiring two ATP per generated pyruvate) but is highly sensitive to oxygen54. A previous study has suggested that the Nitrospinae replace the oxygen sensitive enzymes by less oxygen sensitive versions28. Our results imply that at least under the low oxygen conditions in the GoM, the rTCA cycle in the Nitrospinae is also highly energy efficient.
However, additional factors likely contribute to the apparently higher biomass yield of Nitrospinae when compared to the AOA. According to the most recent metabolic models, the AOA must synthesize at least three enzymes to oxidize ammonia to nitrite55,56. It is noteworthy, that of the six electrons from aerobic ammonia oxidation to nitrite, only two directly contribute to energy conservation51, while the other four are required for the reduction of molecular oxygen during the conversion of ammonia to hydroxylamine by the ammonia monooxygenase.
In comparison, the Nitrospinae have a shorter respiratory chain, oxidizing nitrite to nitrate in a single reaction, before transferring the two electrons from nitrite oxidation to oxygen. Additionally, the active site of NXR in Nitrospinae is located in the periplasm; therefore, the protons generated during nitrite oxidation might directly contribute to the proton motive force, and thus to ATP generation28. All of these factors, which are not captured in thermodynamic comparisons, could lead to a higher than predicted biomass yield of Nitrospinae compared to AOA. In this context, reverse electron transport, which is required for generating reducing equivalents for CO2-fixation in Nitrospinae and AOA, must also be considered. This may be energetically more expensive for Nitrospinae compared to AOA, however, to date, no information is available that allows a meaningful comparison of the actual energetic costs associated to reverse electron transport in Nitrospinae and AOA.
A further factor that could contribute to the apparent differences in biomass yield is mixotrophic growth of Nitrospinae, i.e. assimilation of organic C in addition to autotrophic C-fixation. Mixotrophy would lead to C-assimilation that requires less energy and thus the calculated biomass yield would be an overestimate, as it assumes that the measured N-assimilation is matched by autotrophic C-fixation (see Methods). Nevertheless, comparison of the directly measured 13C-bicarbonate (DIC) assimilation by Nitrospinae and AOA also indicated that the Nitrospinae had a much higher biomass yield (~465 nmol-C per Joule) than the AOA (~105 nmol-C per Joule, Table 1). In principle, the biomass yield of the Nitrospinae could also have been overestimated if they were using other electron donors in addition to nitrite, such as sulfur or hydrogen; however, little evidence for the use of alternative electron donors was found in the investigated Nitrospinae MAGs (see above).
Alternatively, rather than overestimating the biomass yield of the nitrite oxidizers, the yield of the AOA might have been underestimated if they were releasing significant amounts of dissolved organic C (DOC), as recently shown for AOA pure cultures57. If this occurs in the environment as well, it would have wide ranging implications for our understanding of the impact of the highly abundant AOA on C-cycling in the dark ocean.
The fact that the AOA outnumber NOB ten to one in the GoM and other marine systems despite lower AOA growth rates indicates a higher mortality rate of Nitrospinae than of AOA. This mortality could for example be due to viral lysis or zooplankton grazing. We did not perform experiments to assess the relative importance of these two controlling factors. However, both viral lysis and zooplankton grazing have previously been shown to play a major role in bacterioplankton population control58.
Taken together, our results show that despite their lower in situ abundance, Nitrospinae in the GoM are more energy efficient, and grow faster than AOA. If our results can be extended to the rest of the ocean, no additional undiscovered NOB are required to account for the global oceanic balance between ammonia and nitrite oxidation. Furthermore, the results presented here show that Nitrospinae meet most of their cellular N-requirement by the assimilation of N from urea and cyanate, in contrast to AOA, which mainly assimilate ammonium. We hypothesize that differences in mortality, biomass yield and organic N-utilization between Nitrospinae and AOA are likely key factors regulating the abundances of these main nitrifiers in the ocean.
Source: Ecology - nature.com

