Site descriptions, soil and litter layer sampling and analyses
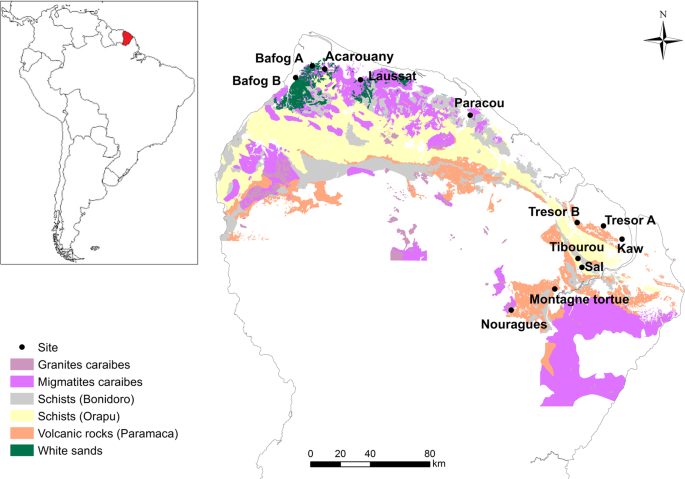
All of the forest sites were located in the Northern region of French Guiana and span various geological substrates (Fig. 1). Soils are mainly classified as Oxisols, Ultisols and Spodosols. Mean annual precipitation ranges from approximately 2,400–4,000 mm yr−1 (Table 1). We created the map in Fig. 1 using ArcGIS, Version 10.355 and shapefiles of the French Guiana boundary, the GPS coordinates of our sampling sites, and maps of geological substrate.
We selected 12 lowland tropical forests with no known history of logging with long-term forest monitoring in French Guiana. Ten out of the 12 sites were in the center of 1 ha forest monitoring plots of the Guyafor network. In July, 2015, we sampled 5 replicate spots within a 20 m × 20 plot. The soil plots were established in the middle of each forest site for the 10 forest monitoring sites. At each spot we first collected the litter layer within a 20 cm2 area. From these same five spots, we then took three soil cores, 3 cm in diameter, down to 30 cm and divided the core into a 0–15 cm topsoil and a 15–30 cm sub-soil sample. Since soil horizonation was different at different sites, we chose these two standard depths to remain consistent across sites. We composited the three cores from each spot to end up with 5 replicate soil samples from each depth for chemical, textural, biological, and mineral analysis. We took an additional 8 cm diameter core at each of the 5 replicate spots from the 0–15 and 15–30 cm depths, taking care to collect the exact volume of the core, for measurement of soil bulk density.
A subsample of the soil sampled for chemical analysis was frozen as soon as possible (within six hours) and then freeze-dried prior to 2 mm sieving. The freeze-dried samples were used for DNA extraction (0.25 g, Powersoil DNA isolation kit, Mobio, Carlsbad CA, USA). Two negative controls were produced by performing all the same steps from DNA isolation onwards to account for potential lab-contamination. One µl of the resulting solution was used as template in a 25 µl PCR containing 0.25 U of Phusion High-Fidelity polymerase (Thermo Scientific, Waltham, MA, USA) in a solution containing 1x PCR buffer, 200 µM dNTP’s, and 200 nM general fungal primers ITS1f and ITS2 augmented with multiplexing barcodes as in56. We used a primer set targeting total fungi because it allows us to (1) simultaneously detect both groups of mycorrhizal fungi (i.e. AM and ECM), and (2) to derive a semi-quantitative estimate of relative abundance of both functional groups. PCR conditions were as follows: initial denaturing at 98 °C for 30 s, followed by an additional round at 98 °C for 30 s, annealing at 55 °C for 30 s, extension at 72 °C for 30 s, the latter three steps of which were repeated for a total of 30 times with an additional final extension step of 72 °C for 10 min. Successful amplification products were pooled and cleaned (Beckman Coulter, Brea, CA, USA), quantified using a Qubit fluorometer (Thermo Fisher Scientific, Waltham, MA, USA), and pooled to equimolar concentrations. This pool was additionally loaded onto a 1% agarose gel and excised to remove remaining primers, cleaned using the QIAquick Gel Extraction Kit (Qiagen, Venlo, the Netherlands) and again quantified. This product was sequenced on an Illumina MiSeq using V2 chemistry (2 × 150) for 300 cycles in the forward direction and 12-cycles for indexing, in presence of a 20% spike of PhiX to ensure sufficient diversity.
Sequences were analysed using the UPARSE pipeline57, with the following steps/settings: sequences were trimmed to 250 bp and quality filtered according to a maximum estimated error of 0.5% leaving a total of 4,424,967 non-singleton sequences, which were clustered to operational taxonomic units (OTU’s) at 97% OTUs similarity. Chimera’s were filtered de novo as well as through using the UNITE58 resulting in a total of 22,572 non-chimeric OTUs. OTUs were aligned to all fungal representative species in the UNITE and INSD database using the BLAST algorithm selecting hits with the lowest E-value using a threshold of max E value of 1 * 10−36 for inclusion (e.g. Waring, et al.59). Because this criterium is very stringent for lineages with high ITS diversity such as Glomeromycota, we additionally analysed sequences at an E value cutoff of 1 * 10−20, but with a minimal alignment length of 150 bp to assign further Glomeromycota. We removed one fungal OTU that occurred in one of the negative controls. Number of reads per sample were then rarefied (rarefy) in VEGAN60 to 2,629 reads which retained a total of 5,132 fungal OTUs, and proportions of AM or ECM fungal reads calculated. The raw sequences were deposited in the National Center for Biotechnology’s Information’s (NCBI’s) Sequence Read Archive database under the accession no. PRJNA603474.
All litter samples were oven dried at 45 °C for 72 hours and weighed to determine litter dry mass. The dried samples were then ground and sub-sampled in duplicate for analysis of %C and %N by dry combustion (Macro Elemental Analyzer, model vario MAX CN, Hanau, Germany). The average of the two %C and %N values is reported, and deviation between samples was <5%. Litter was also measured for total P content on a continuous flow analyzer (SAN++, SKALAR, Breda, NL) after digestion with sulphuric acid, selenium and salicylic acid61.
The soil samples for chemical analysis were sieved to 2 mm and oven dried at 65 °C for 48 hours in order to stabilize them for storage (<1 month) prior to analysis. Half of the sample was ground and used for analysis of %C, %N. The other half of the 2 mm sieved soil was used to measure pH (in KCl, using a Calibration Check pH/mV/ISE/Temerature Benchtop Meter, Hanna Instruments, Temse, Belgium), extractable P using the Bray P method20 and total P content via acid extraction62. All phosphorus extracts were analyzed on a continuous flow analyzer (SAN++, SKALAR, Breda, NL).
The large bulk density cores were sieved to 4 mm and oven dried at 100 °C for 48 hours. We determined the volume of the rocks and roots >4 mm and weighed the oven dried soil <4 mm to calculate soil bulk density. Soil C and N stocks were determined by multiplying bulk density by C and N concentration on a per sample basis. At one site, Sal, the soils were so sandy and unconsolidated that we were unable to collect accurate 15–30 cm cores for bulk density, and thus were unable to calculate soil bulk density and stocks.
Soil texture was determined via the hydrometer method on oven dried soil samples sieved to <2 mm63. A composite soil sample from the five 0–15 and 15–30 cm soil samples from each forest site was used for soil texture. Briefly, we pre-treated all soil samples with 30% H2O2 solution to remove all organic matter. After oven drying, we then shook 40 g of soils with 5% Sodium Hexametaphosphate solution to disperse all aggregates. We determined the percentage of sand sized particles (53–2000 µm) via sieving and determined silt sized (2–53 µm) and clay sized (<2 µm) particles via solution density after 6 hours of settling at 20 °C. In our hydrometer-based soil texture analysis, clay content is defined by particles <2 µm in size and thus contains both clay and metal-oxide minerals.
An aliquot of the same composite soil sample used for soil texture analysis was also used for semiquantitative X-ray diffraction (XRD) particle analysis of soil mineral composition. 2 mm sieved soil samples were ground into powder. Diffractograms of the sample powder were obtained with a PANalytical X’Pert PRO MPD-DY 3197 diffractometer of the Serveis Científico-Tècnics (SCT) of the Universitat de Barcelona. Results were analyzed using the X’Pert HighScore Plus software.
We employed a physical soil organic matter fractionation scheme in order to separate the particulate soil organic matter from the primary organo-mineral complexes34. After dispersion with glass beads, soil from the 0–15 cm depth of five oven dried, 2 mm sieved, soil samples from all forest sites was fractionated into three pools according to the method described in Soong and Cotrufo64. Briefly, a 1.85 g cm−3 sodium polytungstate solution was used to separate the particulate organic matter (<1.85 g cm−3) from the heavy fraction. The heavy fraction (>1.85 g cm−3) was then sieved to separate the sand sized fraction (>53 µm) from the silt & clay sized fraction (<53 µm). Total mass recovery of the three oven dried fractions was +/− 5% from the starting soil mass. The particulate organic matter, sand and silt & clay fractions were ground and analyzed for %C and %N in duplicate by dry combustion elemental analysis (Flash 2000 series CN analyzer, Thermo Scientific, Darmstadt, Germany). Any remaining sample was then analyzed for total P61 on a continuous flow analyzer (SAN++, SKALAR, Breda, Neatherlands).
The data from our July 2015 soil and leaf litter sampling campaign was compared with forest structure and dynamics data from ten long-term forest monitoring sites described in Grau et al.6 and Desprez, et al.65. Our 20 × 20 soil sampling plots were located in the center of these 1 ha forest monitoring plots that were censused for tree species composition and monitored every 2–5 years. Briefly, biomass of each tree with diameter at breast height (DBH) >10 cm was estimated using a pantropical allometric equation66 and summed for all living trees to obtain plot level total aboveground biomass. Aboveground C stocks were calculated by multiplying aboveground biomass by 0.5, the approximate C concentration of woody biomass67,68. Growth rate was calculated as the mean increase in DBH (mm yr−1) and mortality rate was estimated using estimators of instantaneous mortality6,69 i.e. accounting for the initial number of trees in a plot, the number of survivors in a plot, the number of dead trees per plot and time between two consecutive censuses, as described by Grau et al.6. Growth and mortality data were available was not available for the site named KAW, where only aboveground biomass data was available.
Data analysis
We conducted a principal component analysis (PCA) using the ‘Vegan’ package in R 3.2 to identify the relationship between variables of soil, fungi, and forest structure among sites. Based on initial data exploration, we chose to include the soil variables of clay content, Bray P (extractable P), soil C stock, Fe and Al oxide relative content, relative abundance of arbuscular mycorrhizal fungi, relative abundance of ectomycorrhizal fungi, and total P content, along with the forest variables of growth rate, mortality rate, and aboveground C stock. We used data from the nine sites that contained the complete suite of data needed for this analysis.
We used linear regressions for bivariate analysis of soil properties such as soil organic carbon (SOC) stock, % Clay, Total P, Bray-P, surface litter C:N, surface litter P and relative abundance of AM fungi. We analyzed the effect of %Clay content on SOC stocks, total P and Bray-P, the effect of soil total P on litter C:N, litter C:P, litter P, green leaf P, and relative abundance of AM fungi and the effect of total P on relative abundance of AM fungi using restricted maximum likelihood analysis with % Clay as a fixed effect and depth and replicate nested within Site as random effects using the R package ‘nlme’70. We used logarithmic or square root transformations to fit the assumptions of these models when needed (i.e., for soil total P versus % Clay, Bray-P versus % Clay, and AM fungi versus soil total P). We utilized Michaelis-Menten equations to explore the non-linear relationships between soil total P, extractable P and the ratio of extractable-to-total P against soil clay content. These models were written in Stan71 with inference using Hamiltonian Monte-Carlo algorithms and implemented in Rstudio using the Rstan package72.
For the nine sites with multiple years of forest data, we tested the effect of soil total P in the top 0–15 cm depth from the 2015 soil sampling measurements on forest growth and mortality rates measured from 2000–2016 using restricted maximum likelihood with soil total P as a fixed effect and site as a random effect. One additional site (Kaw) had only one year of aboveground biomass data but no information on productivity and mortality. We used the mean value of the five soil samples from the 0–15 cm depth at each site to compare to the singular values of aboveground biomass, tree growth and tree mortality for each site6. We also tested the effect of soil total P in the top 0–15 cm depth from the 2015 soil sampling on aboveground biomass for all ten sites using the same model.
Source: Ecology - nature.com

