Genomic data acquisition
DNA samples from 29 Alpine ibex, 4 Iberian ibex, 2 Nubian ibex, 2 Siberian ibex and 1 Markhor individuals were sequenced on an Illumina Hiseq2500 or Hiseq4000 to a depth of 15–38 (median of 17). Supplementary Table 2 specifies individual sampling locations. Libraries were produced using the TruSeq DNA Nano kit. Illumina sequencing data of 6 Bezoar and 16 domestic goat (coverage 6x–14x, median 12x) were generated by the NextGen Consortium (https://nextgen.epfl.ch). The corresponding raw data were downloaded from the EBI Short Read Archive: ftp://ftp.sra.ebi.ac.uk/vol1/fastq/.
Read alignment and variant calling
Trimmomatic v.0.3651 was used for quality and adapter trimming before reads were mapped to the domestic goat reference genome (version CHIR152,) using Bowtie2 v.2.2.553. MarkDuplicates from Picard (http://broadinstitute.github.io/picard, v.1.130) was used to mark duplicates. Genotype calling was performed using HaplotypeCaller and GenotypeGVCF (GATK, v.3.654,55). VariantFiltration of GATK was used to remove single nucleotide polymorphisms (SNP) if: QD < 2.0, FS > 40.0, SOR > 5.0, MQ < 20.0, −3.0 > MQRandkSum >3.0, −3.0 > ReadPosRankSum >3.0 and AN < 62 (80% of all Alpine ibex individuals). Indels up to 10 bp were also retained and filtered using the same filters and filter parameters, except for not including the filter MQRankSum, because this measure is more likely to be biased for indels of several base pairs. Filtering parameters were chosen based on genome-wide quality statistics distributions (see Supplementary Figs. 23–40). Variant positions were independently validated by using the SNP caller Freebayes (v1.0.2-33-gdbb616056) with the following settings:–no-complex –use-best-n-alleles 6 –min-base-quality 3 –min-mapping-quality 20 –no-population-priors –hwe-priors-off.
To ensure high-quality SNPs, we only retained SNPs that were called and passed filtering using GATK, and that were confirmed by Freebayes. Overall, 97.5% of all high-quality GATK SNP calls were confirmed by Freebayes. This percentage was slightly lower for chromosome X (96.7%) and unplaced scaffolds (95.2%). We tested whether the independent SNP calls of GATK and Freebayes were concordant and we could validate 99.6% of the biallelic SNPs. We retained genotypes called by GATK and kept SNPs with a minimum genotyping rate of 90% for all further analysis. The total number of SNPs detected was 59.5 million among all species. Per species, the number of SNPs ranged from 21.9 million in the domestic goat (N = 16) to 2.0 million in Markhor (N = 1, Supplementary Table 2).
RNA-seq data generation
Tissue samples of a freshly harvested Alpine ibex female were immediately conserved in RNAlater (QIAGEN) in the field and stored at −80 °C until extraction. The following ten organs were sampled: retina/uvea, skin, heart, lung, lymph, bladder, ovary, kidney, liver, and spleen. RNA was extracted using the AllPrep DNA/RNA Mini Kit from Qiagen following the manufacturer’s protocol. Homogenization of the samples was performed using a Retsch bead beater (Retsch GmbH) in RLT plus buffer (Qiagen). RNA was enriched using a PolyA enrichment protocol implemented in the TruSeq RNA library preparation kit. Illumina sequencing libraries were produced using the Truseq RNA stranded kit. Sequencing was performed on two lanes of an Illumina Hiseq4000.
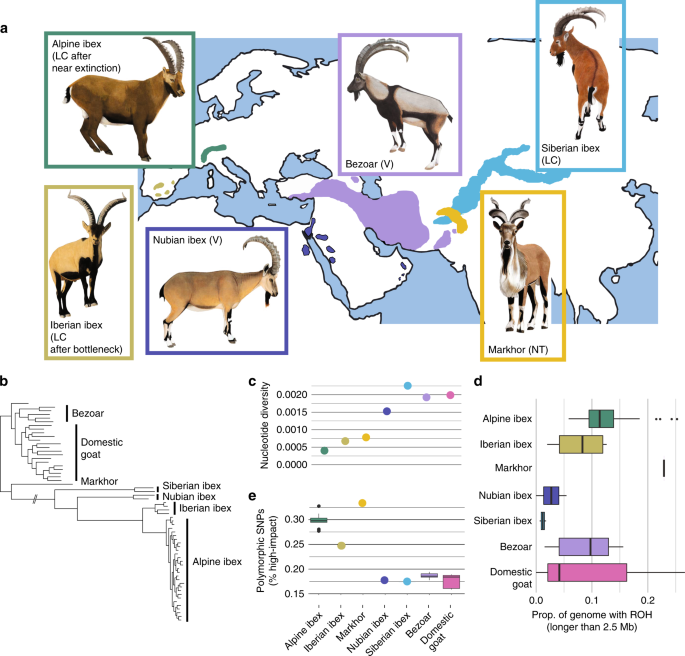
Genetic diversity and runs of homozygosity
Genetic diversity measured as individual number of heterozygous sites and nucleotide diversity were computed using vcftools57. Runs of homozygosity were called using BCFtools/RoH58, an extension of the software package BCFtools, v.1.3.1. BCFtools/RoH uses a hidden Markov model to detect segments of autozygosity from next generation sequencing data. Due to the lack of a detailed linkage map, we used physical distance as a proxy for recombination rates with the option −M and assuming 1.2 cM/Mb following sheep recombination rates59. Smaller values for −M led to slightly longer ROH (Supplementary Figs. 3–5). Because of small per population sample size, we decided to fix the alternative allele frequency (option -AF-dflt) to 0.4. Estimates for the population with the largest sample size (Gran Paradiso, N = 7) were very similar if actual population frequencies (option –AF-estimate sp) were used (Supplementary Figs. 4 and 5). Option –viterbi-training was used to estimate transition probabilities before running the HMM. Running the analysis without the option –viterbi-training led to less but longer ROH (Supplementary Figs. 3–5). ROH were also estimated using PLINK (v1.90b5, https://www.cog-genomics.org/plink/) with the following settings:–homozyg-window-het 2, –homozyg-window-missing 5, –homozyg-snp 100, –homozyg-kb 500, –homozyg-density 10, –homozyg-gap 100, –homozyg-window-threshold .0. ROH estimates based on PLINK were overall slightly lower but the qualitative trends hold among species and population (Supplementary Figs. 41 and 42).
Identification of high-confidence deleterious mutations
Three lines of evidence were used to identify high-confidence deleterious mutations. First, variants leading to a functional change are candidates for deleterious mutations. We used snpEff 60 v.4.3 for the functional annotation of each variant. The annotation file ref_CHIR_1.0_top_level.gff3 was downloaded from: ftp://ftp.ncbi.nlm.nih.gov/genomes/Capra_hircus/GFF and then converted to gtf using gffread. Option −V was used to discard any mRNAs with CDS having in-frame stop codons. SnpEff predicts the effects of genetic variants (e.g. stop-gain variants) and assesses the expected impact. The following categories were retrieved: high (e.g. stop-gain or frameshift variant), moderate (e.g missense variant, in-frame deletion), low (e.g. synonymous variant) and modifier (e.g. exon variant, downstream gene variant). In the case of overlapping transcripts for the same variant, we used the primary transcript for further analysis. A total of 49.0 % of all detected SNPs were located in intergenic regions, 43.2 % in introns, 6.5% down- and upstream of genes. A total of 0.7% of variants were within CDS, of which ~60% were synonymous and ~40% were missense variants. Overall, 0.002% were stop-gain mutations.
Protein sequences were annotated using InterProScan v.5.33 by identifying conserved protein family (PFAM) domains61.
Second, we assessed the severity of a variant by its phylogenetic conservation score. A non-synonymous variant is more likely to be deleterious if it occurs in a conserved region of the genome. We used GERP conservation scores, which are calculated as the number of substitutions observed minus the number of substitutions expected from the species tree under a neutral model. We downloaded GERP scores (accessed from http://mendel.stanford.edu/SidowLab/downloads/gerp), which have been computed for the human reference genome version hg19. The alignment was based on 35 mammal species but did not include the domestic goat (see https://genome.ucsc.edu/cgi-bin/hgTrackUi?db=hg19&g=allHg19RS_BW for more information). Exclusion of the focal species domestic goat is recommended for the computation of conservation scores, as the inclusion of the reference genome may lead to biases62. In order to remap the GERP scores associated to hg19 positions to the domestic goat reference genome positions, we used liftOver (hgdownload.cse.ucsc.edu, v.287) and the chain file downloaded from hgdownload-test.cse.ucsc.edu/goldenPath/capHir1.
Third, we ascertained support for gene models annotated in the domestic goat genome with expression analyses of Alpine ibex tissue samples. We included expression data from 10 organs of an Alpine ibex female (see RNA-seq data section above) to assess expression levels of each gene model. Quality filtering of the raw data was performed using Trimmomatic51 v.0.36. Hisat263 v.2.0.5 was used to map the reads of each organ to the domestic goat reference genome. The mapping was run with option –rna-strandness RF (stranded library) and supported by including a file with known splice sites (option –known-splicesite-infile). The input file was produced using the script hisat2_extract_splice_sites.py (part of hisat2 package) from the same gtf file as the one used for the snpEff analyis (see above). For each organ, featureCounts64 (subread-1.5.1) was used to count reads per each exon using the following options: -s 2 (reverse stranded) –f (count reads at the exon level), –O (assign reads to all their overlapping features), –C (excluding read pairs mapping to different chromosomes or the same chromosome but on a different strand). The R package edgeR65 was used to calculate FPKM (Fragments Per Kilobase Of Exon Per Million Fragments Mapped) per each gene and organ. For variant sites that were included in more than one exon, the highest FPKM value was used. We found that 16,013 out of 17,998 genes showed transcriptional activity of at least one exon (FPKM > 0.3). Overall 166,973 out of 178,504 exons showed evidence for transcription. In a total of 1928 genes, one or more exons showed no evidence for transcription. Retained SNPs were found among 118,756 exons and 17,685 genes. Overall 611,711 out of 677,578 SNPs were located in genes with evidence for transcription.
Deleterious mutations are assumed to be overwhelmingly derived mutations. We used all ibex species except Alpine and Iberian ibex as an outgroup to define the derived state. For each biallelic site, which was observed in alternative state in Alpine ibex or Iberian ibex, the alternative state was defined as derived if its frequency was zero in all other species (a total of 44,730 autosomal SNPs). For loci with more than two alleles, the derived state was defined as unknown. For comparisons among all species, we only used the following criteria to select SNPs (370’853 biallelic SNPs retained): transcriptional activity (FPKM > 0.3 in at least one organ) and GERP > −2. The minimum GERP score cutoff was set to retain only high-quality chromosomal regions following previously established practice e.g.23. We further followed the following categorizations adopted for human populations to identify moderate to highly deleterious mutations e.g.:23 −2 to +2 is considered neutral or near neutral, 2–4 considered as moderate, 4–6 as large and >6 as extreme effects. We also required a minimal distance to the next SNP of 3 bp to avoid confounding effects of potential multi-nucleotide polymorphisms (MNPs).
Population genetic analyses
SFSs were calculated using the R packages plyr and dplyr. SFS analyses were performed for SnpEff and GERP categories and two additional conservation scores: phyloP66 and phastCons67. We chose a cutoff of 1 to distinguish conserved from less conserved sites. In the case of phyloP, sites with a score above 1 were defined as conserved. For phastCons, sites with a score equal to 1 (the maximum observed value) were considered as conserved.
For individual counts of derived alleles or homozygotes, we used all biallelic sites polymorphic either in Alpine or Iberian ibex (or both) for which the derived state was known with a maximal missing rate per locus of 10%. We retained all sites matching these criteria for any downstream analyses even if a particular site was not polymorphic in any given population. The effective rate of missing data per locus was between 0.03–0.07% (Supplementary Fig. 43) and no correlation was found between missing rate per population and counts. We found no qualitative differences if we included only loci with a 100% genotyping rate (Supplementary Fig. 44).
We calculated the relative number of derived alleles Rxy28 for the different categories of mutations. Rxy compares the number of derived alleles found at sites within a specific category. Following9,28, we used a random set of 65592 intergenic SNPs for standardization, which makes Rxy robust against sampling effects and population substructure. We performed the Rxy analysis for the four SnpEff categories as well as four additional mutation scoring methods: SIFT68, REVEL69, CADD70, and VEST371. Human scores mapped to hg38 chromosomal positions were retrieved using the web interface of the Variant Effect Predictor (VEP) by ensemble72. The scores were mapped to chromosomal positions in the domestic goat reference genome using liftOver (http://hgdownload.cse.ucsc.edu, v.287) with the chain file accessed from http://hgdownload-test.cse.ucsc.edu/goldenPath/capHir1. As we applied these scores outside of humans, we did not have pathological evidence underpinning score cut-offs for deleteriousness. We conservatively used score cut-offs proposed as best-practices by the tool developers (Revel: 0.75, CADD: 20, SIFT: 0.05) or used a very conservative percentile (99%, 0.91 VEST3).
Individual-based simulations with Nemo
Individual-based forward simulations were run using the software Nemo48 v.2.3.51. A customized version of aNEMOne73 was used to prepare input files for parameter exploration. The sim.ini file for the final set of parameters run in 100 replicates is available as Supplementary Note 1. All populations relevant for the founding of the populations under study were included in the model. See Fig. 6a for the simulated demography, which was modeled with the actual founder numbers (assuming a sex-ratio of 1:1), while the translocations were simplified into four phases (data from ref. 48, DRYAD entry https://doi.org/10.5061/dryad.274b1 and46). The harmonic mean of the population census from the founding up to the final sampling year (2007) was used to define the population carrying capacity. Mating was assumed to be random and fecundity (mean number of offspring per female) set to five. The selection coefficients of 5000 biallelic loci subject to selection against deleterious mutations were drawn from a gamma distribution with a mean of 0.01 and a shape parameter of 0.3 resulting in s <1% for 99.2% of all loci74 (Supplementary Fig. 45). Based on empirical evidence, we assumed a negative relationship between h and s75. We used the exponential equation h = exp(−51*s)/2 with a mean h set to 0.37 following76. We assumed hard selection acting at the offspring level. In addition to the 5000 loci under selection, we simulated 500 neutral loci. Recombination rates among each neutral or deleterious locus was set to 0.5. This corresponds to an unlinked state. Initial allele frequencies for the burn-in were set to µ / h * s = 0.0014 (corresponding to the expected mean frequency at mutation-selection balance77). Mutation rate µ was set to 5e−05 and deleterious mutations were allowed to back-mutate at a rate of 5e−07.
A burn-in of 3000 generations was run with one population (N = 1000) representing the entire species. The burn-in was designed to be too short to reach mutation-drift-selection equilibrium to retain segregating deleterious mutations. The number of segregating deleterious mutations and heterozygosity at deleterious mutation loci changed rapidly early in the burn-in, reached a plateau at ~3000 generations before slowly decreasing. N was reduced to N = 500 for five generations before a brief, two generation bottleneck of N = 80. At generation 3007, the population recovered to N = 1000 and three generations later the reintroduction was started with the founding of the two zoos Interlaken Harder (ih) and Peter and Paul (pp). The founding of new populations was modeled by migration of offspring into an empty patch.
The zoo ih (Interlaken Harder) and several populations did not survive all replicates of the simulations. Extinction rates were as follows: ih (Zoo Interlaken Harder) 84%, bo (Bire Öschinen) 3%, wh (Weisshorn) 3%, ob (Oberbauenstock) 9%, am (Alpi Marittime) 14%, and pil (Pilatus) 2%. The high extinction rate of the zoo Interlaken Harder did not affect the outcome of the simulations. The extinctions were a result of the strong reduction in population size during the founding and occurred always after the founding (see also Supplementary Fig. 16). The extinctions of the reintroduced populations did not affect the estimates of derived allele counts but reduced sample sizes and, hence, affected the variance of estimators. Genetic load information was retrieved using the delet statistics option and is defined in Nemo as the mean realized fitness (L = 1−Wmean/Wmax, where Wmax is the maximum number of surviving offspring per female computed from her deleterious mutations).
Ethics statement
This work complies with institutional guidelines and was authorized by the Swiss animal experimentation permit no. GR_6/2007.
Reporting summary
Further information on research design is available in the Nature Research Reporting Summary linked to this article.
Source: Ecology - nature.com

