Study area
The Pantanal is a vast floodplain crossed by the Paraguay River and its tributaries, extending throughout Brazil, Paraguay, and Bolivia, with an area of approximately 140,000 km2 25. This large wetland has a predictable and monomodal flood pulse, with low amplitude and long duration26, and the structure and dynamics of the Pantanal are dependent on the fluctuating levels of flooding10,27.
We conducted the study at Taiamã Ecological Station (TES) (Fig. 1) and the nearby areas of Sararé Island and the Jubran Private Reserve in the Pantanal subregion of Cáceres where it is possible to find floodplains covered by grasses and other herbaceous plants, floating meadows (batumes), pioneer forests, and large monodominant stands of E. fusca, locally known as abobral28. We created the map using the software QGis Versão 3.429, all the shapefiles used are open access. The shapefiles of Brazilian states was provided by the Instituto Brasileiro de Geografia e Estatística30, Pantanal provided by Ministério do Meio Ambiente31 and TES provided by Instituto Chico Mendes de Conservação da Biodiversidade32.
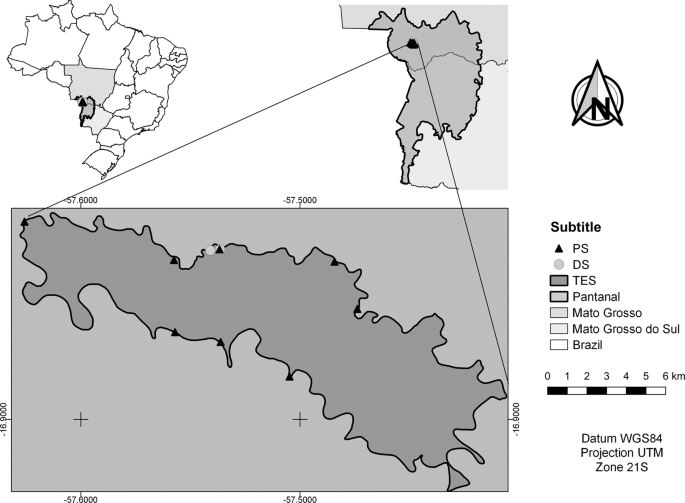
Monodominant stands of E. fusca sampled from population structure analysis (PS) and areas of destructive sample collection (DS) at Taiamã Ecological Station (TES) in the northern Pantanal subregion of Cáceres, Mato Grosso State, Brazil.
The climate is seasonal Aw in the Köppen classification33 with a dry season from May to September and a rainy season from October to April15. In the Pantanal subregion of Cáceres, high flooding levels almost coincide with the rainy seasons (Fig. 2). The average annual temperatures are around 26 °C, ranging from a minimum average of 20 °C to the maximum of 31 °C, and the average annual precipitation is 1227 mm. We calculated these values for the years between 1980 and 2014 from data obtained from the Instituto Nacional de Meteorologia (Brazilian National Institute of Meteorology)34 and the Marinha Brasileira (Brazilian Navy)35.
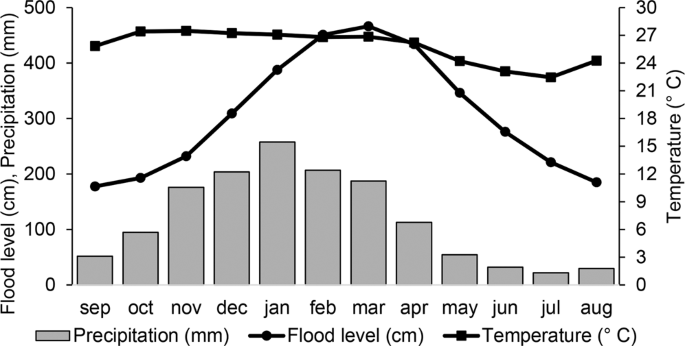
Average flood levels of the Paraguay River, annual precipitation, and temperature between 1980 and 2014 in the northern Pantanal subregion of Cáceres, Mato Grosso, Brazil.
In the subregion, the predominant soil is Eutrophic Gleysol36, which remains periodically saturated by water stagnation or the occurrence of lateral flow in the soil. The striking feature of this soil type is its strong gleization owing to a reduced environment wherein the water saturation throughout the year, combined with oxygen demand for biological activities, leads to low dissolved oxygen concentration in soil37.
Considering that the Pantanal is in Southern Hemisphere, it is important to remember that, for some species the growth of tree rings begins at the beginning of the rainy season15,38,39, which corresponds to October, that is, the growing year of the plant does not follow the calendar. Thus, in results (Figures) the months designated with (−1) indicate the growth season in the previous year and (+1) indicate the change of the calendar year during the growing season in the Southern Hemisphere, similar methodology is used by other authors in recent papers (e.g. Fortes et al.15; Locosselli et al.40; Locosselli et al.41).
Species description
E. fusca (Fabaceae) is a tree species (20–30 meters high) with a globose treetop and short and branched trunk, prickly when young. The leaves are alternate, composite, trifoliolate, with leathery leaflets, glabrous. The inflorescence is in the form of terminal racemes, with showy yellow-orange flowers19. This is a pioneer, heliophyte, deciduous species, tolerant to flooding19,20, which occurs naturally in riparian forests and blooms from May to September, with intense fructification starting in November19,21. During fieldwork, we observed that adult individuals of E. fusca showed a pattern of prop roots which seems to help improve root oxygen levels and root fixation on the soil during flooding, we also observed that the higher the flood level, the more prop roots could be found in individuals.
Monodominant stands of E. fusca occur on the plains of the northern Paraguay River, in the Cáceres subregion, and along the banks of the Aquidauana River18. In the dry season, this species occupies an area of approximately 18 km2, which represents 16% of the station area28. These monodominant stands are low-density vegetation with predominance of arboreal individuals of E. fusca (approximately 77% of the community), along with another 10 tree/shrub species (Unpublished data). The herbaceous stratum is very homogeneous, dominated by grasses, and the soil is covered by a histosol layer with leaf litter, mostly composed of E. fusca leaves.
We collected and prepared a fertile sample of E. fusca according to herbarium techniques42,43 and deposited the voucher in the CGMS Herbarium under registration CGMS 40967.
Collection and sample preparation
Considering that the area was a Brazilian Federal Conservation Unit (Taiamã Ecological Station) with a limited permission to cut trees (for this project we were allowed to collect only seven individuals), in December 2013, we selected two sample areas (Fig. 1) where we marked seven E. fusca trees of different diameters. In each tree, we used the Mariaux Windows method44, which starts by using a mechanical incision to remove part of the bark from the tree to expose the vascular cambium. After two years, in December 2015, we collected these trees using the destructive method. These destructive samples were included in the total sampling, but they were also used for knowledge of wood anatomy, growth ring pattern determination, and presence/absence of false or missing rings.
After previous analysis of the discs (destructive samples) and verification that there were no missing or false rings that could lead to misinterpretation of data, we decided to complement sampling with the use of non-destructive method. The non-destructive method has been used by several authors (e.g. Schöngart et al.45; Fonseca-Junior et al.46; Locosselli et al.41; Andrade et al.47; Neves et al.48) in recent research in tropical trees with good results of ring analysis. In December 2016, using the non-destructive method, we extracted cores from the stems of 29 trees (one or two cores per stem, but we used the one that allowed the best view of the rings) using an increment borer (Pressler borer) 5 mm in diameter. These non-destructive samples were collected over the E. fusca monodominance areas at Taiamã Ecological Station, close to where we collect the destructive samples, according to the availability of collect individuals of different diameters. In the field, we measured the diameter at breast height (DBH) with a diametric tape and the height of all trees using a hypsometer.
We kept samples at room temperature until completely dried to avoid cracking. Then we polished the samples with sandpaper of different grains (80, 100, 180, 220, 320, 400, 600, and 1200) so that the growth rings and anatomical characteristics of the wood could be visualized24.
Anatomical procedures
The growth rings were delimitated with anatomical analyses. We analyzed the anatomical samples at the Laboratório de Anatomia Vegetal of Universidade Federal de Mato Grosso do Sul (UFMS). For anatomical description and determination of tree-rings, we used 1 × 1 × 2 cm wood samples of three E. fusca individuals. We boiled the wood samples in glycerin solution (50%) for 15 minutes to soften the wood. Afterwards, we prepared sections (longitudinal and cross planes) of about 25 µm thickness using a sledge microtome (Leica SM2000R). The sections were bleached with sodium hypochlorite, washed in distilled water and acetic acid (1%), and stained with alcian blue and safranin, both in the concentration of 1% in water, proportion of 9:149. Macerations were prepared using wood segments dissociated in hydrogen peroxide and glacial acetic acid (1:1) and heated in an oven at 60 °C for 12 h. Isolated cells were stained with 1% Safranin or 12:25% basic fuchsin, in 50% ethanol and mounted in 50% glycerin solution. To detect lignified secondary wall, we performed a histochemical test with acidic phloroglucin (phoroglucinol, HCl and ethyl alcohol) in which the lignified cell wall becomes violet-red50. We analyzed and photographed the sample under a microscope. The descriptions of wood constituents followed the guidelines of the IAWA Committee51.
After defining the anatomical and growth ring characteristics, we measured the width of the tree-rings. To do this, we used a tree-ring measurement (LintabTM 6) with precision of 0.01 mm, together with TSAP-WINTM Scientific software (Time Series Analysis and Presentation), which is specific for time sequence analysis. We analyzed the samples at the Laboratório de Ecologia Vegetal of Universidade Federal de Mato Grosso do Sul (UFMS). The tree-rings were delimited and measured according to the classification of Coster52,53, as adapted by Worbes24.
Growth modeling and population structure
After we measured the width of the rings, we generated the individual radial increase rates, from which we obtained the rates of mean diameter increment (MDI) in millimeters. We built the cumulative diameter growth curves and then fitted to the DBH obtained in the field14. Through adjustments of the cumulative diameter growth curves, we obtained the relationship between age and diameter of individuals54,55,56. Based on the individual cumulative diameter growth curves, we calculated the mean diameter growth curve, which was fitted to a sigmoidal regression model, to obtain the relationship between age and diameter55,56, according to:
$$DBH=(frac{{beta }_{0}}{1+{(frac{{beta }_{1}}{age})}^{{beta }_{2}}})$$
where DBH is the diameter at breast height (cm) and β0, β1 e β2 are equation parameters para for the model obtained by the non-linear regression fit.
The relationship between DBH and the height of trees sampled (H) was adapted to a non-linear regression, according to Schöngart55,56. The regression models were produced using the Xact software (SciLab).
We sampled monodominant stands of E. fusca (MSEF) in eight areas (Fig. 1), distributed throughout the TES (over 115 km2), and in each area, we established three 50 × 5 m plots with a minimum distance of 20 m between them, totaling 0.6 ha. We allocated the plots in order to best show different elevations and respective flooding durations of the Paraguay River levees. Trees with circumference at breast height (CBH) of ≥15 cm were included in the sampling. Bifurcated stems were only included if at least one had a circumference ≥15 cm. We did not find individuals below 15 cm of CBH. We transformed the data of CBH into DBH (diameter at breast height) before performing analyses. We also measured the height of trees with a hypsometer.
Using population sampling data, we constructed a new correlation of diameter with height of the individuals, adapted to a nonlinear regression55. In addition, using the values of DBH and the age of each sample, we calculated the age of the individuals included in the population sample.
We also distributed the individuals in classes of diameter with intervals of classes defined by Spiegel’s formula57 constituted by A/K, where A represents the breath of data (diameter), and K represents the algorithm of Sturges: K = 1 + 3.3 log N, where N is the number of individuals sampled. Considering the relationship between diameter/age of individuals sampled for dendrochronological analyses, we calculated the age of all the individuals sampled from the population.
Since the number of individuals in the largest diameter classes tends to experience a natural decrease, we were unable to perform a direct analysis between the environmental factors and the number of individuals in each diameter class. Therefore, we used the distribution of individuals in the first five diameter/age classes (classes with more than five individuals, totaling the last 35 years), to build a series that contains maximum and minimum values of flooding levels and total precipitation data for the years falling into each class. To verify differences in the levels of these factors between age groups, we performed analysis of variance, followed by the Tukey 5% test using R software and the agricolae package58.
We determined the duration of flooding of each plot. First, we measured from the ground the height of the water mark left by the last inundation on tree trunks inside the plots. Then, we obtained an average of the water marks per plot and compared these values with the highest level recorded at the hydrometric gauge of Cáceres during that year of sampling. Considering that the overall topography is very flat and that no tributaries flow between the gauge and the sampled area, we considered variation in water level to be the same. Using these data, we calculated the topographic position of each plot in relation to zero by the Cáceres gauge. Thus, we used ten years of data to calculate an average period of flooding for each plot.
With the calculations above mentioned we observed that the monodominant stands of E. fusca in the Pantanal subregion of Cáceres were subjected to different periods of flooding, ranging from 42 to 117 days per year. Therefore, to observe the differences in the distribution of individuals in diameter and age class subjected to different flood periods, we divided the plots into two parts (i.e., half the total length of the inundation gradient) based on the results obtained by Damasceno-Junior et al.59 and Arruda et al.60. Therefore, half of the plots were in the first category (flooding between 42–78 days per year) with 62 individuals, while the second category (flooding between 79–117 days per year) presented 91 individuals. To compare the number of individuals within diameter classes between flood periods (42–78 and 79–117), we used a chi-square test with R software61.
Environmental variables
We used the weather data corresponding to the period from 1981 to 2014. We obtained the precipitation data from KNMI Climate Explorer62. We obtained the data on daily flood level of the Paraguay River in the study subregion from the Marinha do Brasil (Brazilian Navy)35. The records of ENSO events (El Niño 1 + 2, El Niño 3, El Niño 3.4 and El Niño 4), Pacific Decadal Oscillation (PDO), and Southern Oscillation Index (SOI) were obtained from the database available on the National Oceanic Atmospheric Administration (NOAA)63.
Chronology and correlations with climatic variables
We used standard dendrochronological techniques to cross-date the time series of different individuals and combine these time series with a main chronology64. The cross-dating process comprises overlapping individual indexed curves, matches the variations in rings width between trees and checking relationships between dating to infer where rings are missing, false or incorrectly observed13,23,45,65,66. We visually and statistically checked the increment curves pairwise with cross-dating to build an average chronology based on the growth ring series of all individuals65. We used the TSAP-WINTM software to describe the similarity between individual curves. Percentage of parallel run was used to indicate the year-to-year agreement in the oscillation of two curves within the overlapping interval67. The samples without the pith were carefully analyzed, paired (visually and statistically) and cross-dating with the other curve samples according to the similarity between the individual curves, the comparison of diameters and according to the pith distance, thus, it was possible to estimate the average number of missing rings, similar methodology is used by other authors (e.g. Brienen et al.68). Cross-dating was visually and statistically validated by the coefficient of coincidence Gleichlaeufigkeit (GLK) and the T value65,69. Both concepts are used to verify the quality of agreement between temporal series, and GLK is specially developed for growth ring cross-dating65. After this process, the best individual time series were selected for the construction of the average time series (chronology).
The curves standardization removes the effects of ring-width reduction associated with environmental fluctuations, changes in age and position within the stem, and site productivity conditions66. To remove long-term growth trends related to increasing tree age and size, or even from changes in the surrounding forest, causing effects on competitive structure66, a five-year moving average was used to convert crude tree-ring curves into growth indices. This procedure results in normally distributed data, which is an elementary condition for correlation with climate variables70.
To verify if the species is sensitive to environmental variations we calculated the mean sensitivity, which expresses the relative year-to-year variation in ring width66. We tested the significance of the relationships between climatic factors and chronology of E. fusca using correlation matrices, and we built the graphics using R software61.
Source: Ecology - nature.com

