Morphological characteristics of rice seedlings
On D10 (the 10th day after sowing), rice seedlings in the M treatment (ramie fiber nonwoven film present) were 12.7% shorter than seedlings in the NM treatment group (not using the film). By D20 (the 20th day after sowing), rice seedlings in the M treatment group were still shorter than the NM treatment seedlings, but the difference was no longer significant (Table 1). On D10, seedlings in the M treatment produced 12.6% less shoot fresh weight, and 17.0% more root fresh weight than NM seedlings. Similarly, on D20, shoot fresh weight of the rice seedlings in the M treatment was 17.6% less than the NM treatment seedlings, while no significant difference in root fresh weight was observed. Differences between M and NM treatment seedlings in biomass dry weight were similar to those in fresh weight (Table 1). Correspondingly, the average root/shoot ratio of rice seedlings in the M treatment was significantly higher than that in the NM treatment group; in terms of fresh weight, the root/shoot ratio increased by 34.5% and 23.1% on D10 and D20, respectively, and in terms of dry weight, the root/shoot ratio increased by 40.6% and 32.0% on D10 and D20, respectively (Table 1).
Soluble sugar and nitrate content in rice seedlings
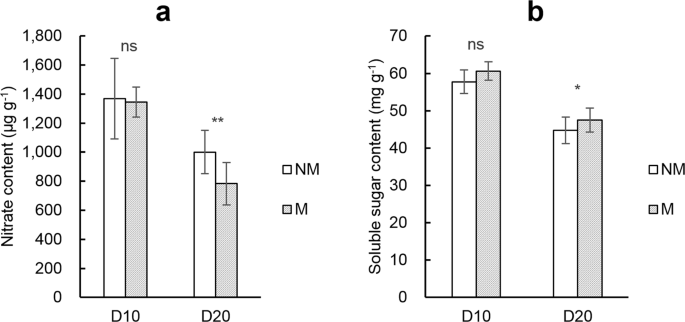
On D10, the average nitrate content in rice seedlings in the M treatment group was 1344.9 μg g−1, slightly lower than the NM treatment group (Fig. 2a), the average soluble sugar content was 60.6 mg g−1, slightly higher than the NM treatment (Fig. 2b), but none of the differences were statistically significant. By D20, the difference between the treatments was greater, as rice seedlings under the M treatment had an average of 21.7% lower nitrate content and 6.3% higher soluble sugar content than seedlings in the NM treatment.

Average nitrate (a) and soluble sugar content (b) in rice seedling shoots on D10 and D20. NM and M represent not padding and padding with ramie fiber nonwoven films on the bottom surface of the seedling tray, respectively. Error bars represent SE (n = 3). ns, * and ** denote non-significance, significant differences at the 0.05 probability level, and significant differences at the 0.01 probability level between NM and M in each sampling batch (by paired T-test), respectively.
Soil pH and EC
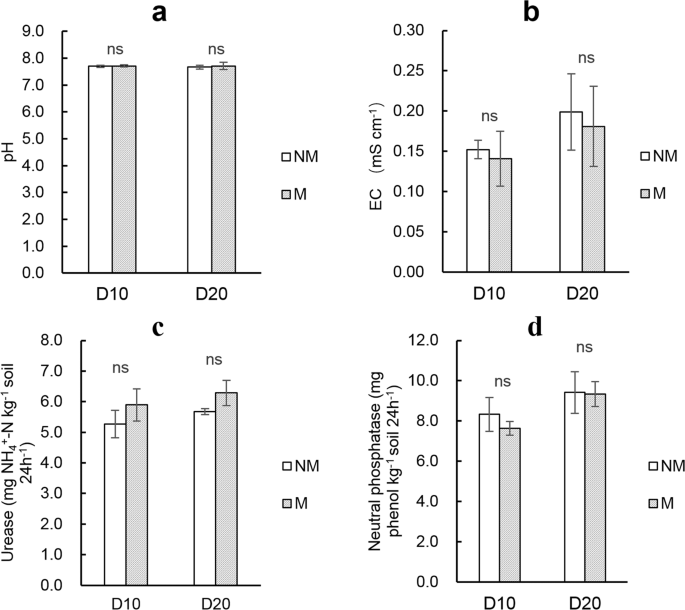
The application of ramie fiber nonwoven film had no evident effect on root-zone soil pH, which was about 7.7 on both D10 and D20 (Fig. 3a). Soil EC in the M treatment soils was 0.14 and 0.18 mS cm−1, on D10 and D20, respectively; and the M group data were slightly lower than the NM treatment mean EC, but the differences were not significant (Fig. 3b).

Root-zone soil pH (a), EC (b), soil urease (c) and neutral phosphatase activity (d) on D10 and D20. NM and M represent not padding and padding with ramie fiber nonwoven film on the bottom surface of the seedling tray, respectively. Error bars represent SE (n = 3). ns, * and ** denote non-significance, significant difference at the 0.05 probability level, and significant difference at the 0.01 probability level between NM and M in each sampling batch (by paired T-test), respectively.
Soil nutrients
Compared with the NM treatment, the M treatment had higher soil nitrogen nutrition (Table 2). On D10, mean total nitrogen, nitrate nitrogen, ammonium nitrogen, and alkali-hydrolyzed nitrogen contents in the root-zone soil were 4.9%, 25.4%, 2.3%, and 9.3% higher in the M treatment compared with the NM treatment, but all the differences were not significant except for the alkali-hydrolyzed nitrogen content (p = 0.0343). By D20, the gaps between the treatments expanded, and the increase in the M treatment compared to the NM treatment reached 4.7%, 39.3%, 14.6%, 11.5%, respectively, but the only significant difference was in the nitrate nitrogen content (p = 0.0148). Compared with the NM treatment, mean available potassium content in root-zone soils in the M treatment increased, while average organic matter and available phosphorus content decreased, but these differences were not significant (p > 0.05).
Soil enzyme activity
Average soil urease activity in the M treatment was 5.9 and 6.3 mg NH4+-N kg−1 soil 24 h−1 on D10 and D20, respectively, and was slightly higher than that under NM, which was 5.3 and 5.7 mg NH4+-N kg−1 soil 24 h−1 on D10 and D20, respectively (Fig. 3c). Soil neutral phosphatase activity in the M treatment was 7.6 and 9.3 mg phenol kg−1 soil 24 h−1 on D10 and D20, respectively, and was slightly lower than that under NM, which was 8.3 and 9.4 mg phenol kg−1 soil 24 h−1 on D10 and D20, respectively, but these differences were not significant (Fig. 3d).
Soil bacterial community
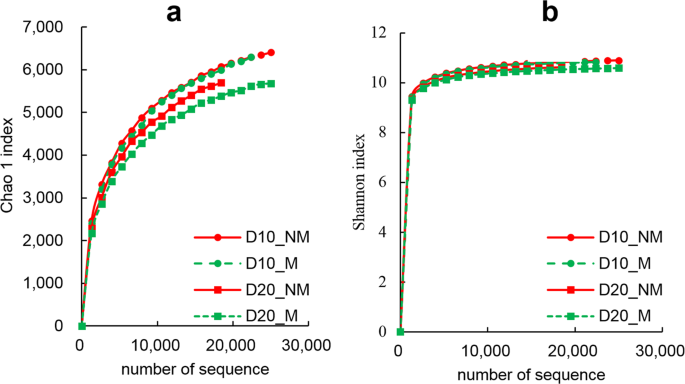
The Chao1 index of the root-zone soil bacterial community in the M treatment was slightly lower than that in the NM treatment on both D10 and D20 (Fig. 4a). From D10 to D20, the Chao1 index decreased, and compared with the NM group, the decline was greater in the M treatment group, indicating that the soil bacterial diversity in the seedling root-zone decreased as a function of seedling growth time, and the application of the ramie fiber nonwoven film could further reduce it. The Shannon index reflected basically the same trend as the Chao 1 index (Fig. 4b).

The Chao1 index (a) and Shannon index (b) of the soil bacterial community in the root-zone on D10 and D20. NM and M represent not padding and padding with ramie fiber nonwoven film on the bottom surface of the seedling tray, respectively.
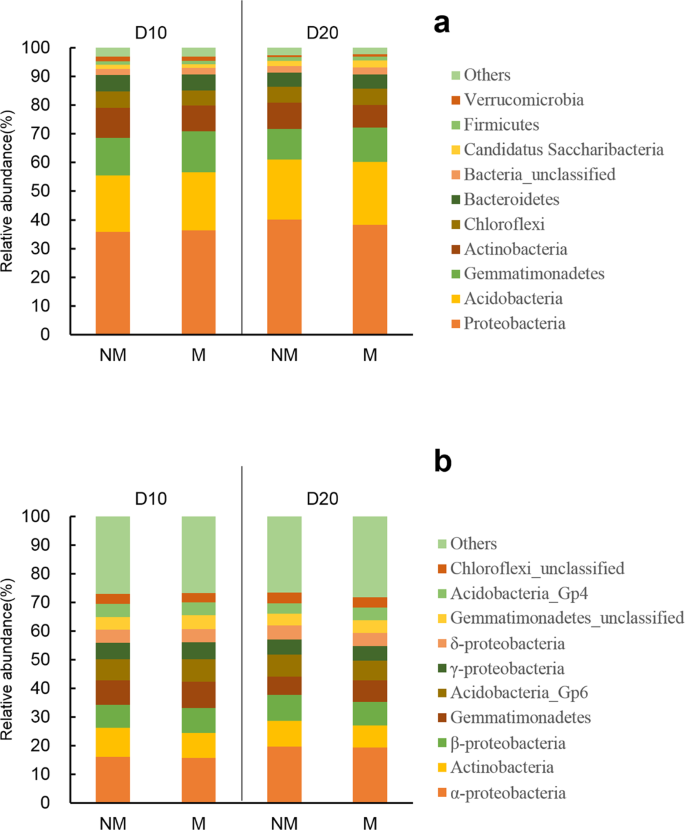
The highest relative abundance in the soil bacterial community was Proteobacteria (Fig. 5a). In the M treatment it comprised 36.28% and 38.26% of the community on D10 and D20, respectively, and in the NM treatment it comprised 35.78% and 40.08% of the community on D10 and D20, respectively. Followed by Acidobacteria, Gemmatimonadetes, and Actinobacteria, whose total relative abundance when combined with Proteobacteria was close to or over 80% in each treatment. Among different classes of Proteobacteria, α-Proteobacteria always accounted for the highest proportion (about 47%), followed by β-Proteobacteria, γ-Proteobacteria, and δ-Proteobacteria, which each accounted for about 22%, 15%, and 12%, respectively (Fig. 5b).

Relative abundance of dominant phyla (a) and classes (b) of root-zone soil bacterial on D10 and D20. NM and M represent not padding and padding with a ramie fiber nonwoven film on the bottom surface of the seedling tray, respectively.
Compared with NM, the M treatment community showed a trend of increased relative abundance of Acidobacteria and Gemmatimonadetes, but decreased relative abundance of Actinobacteria (Fig. 5a). On D10, the relative abundance of Acidobacteria and Gemmatimonadetes was 20.38% and 14.27%, respectively in the M treatment soils, and 19.75% and 13.00%, respectively in the NM treatment soils. On D20, the relative abundance of Acidobacteria and Gemmatimonadetes was 22.05% and 11.90%, respectively in the M treatment soils, and 20.91% and 10.67%, respectively in the NM treatment soils. The relative abundance of Actinobacteria on D10 and D20 in the M treatment soils was 8.95% and 7.86%, respectively, while the NM treatment soils was 10.57% and 9.15%, respectively.
Source: Ecology - nature.com


