Study sites
We studied two oil palm plantations in the Jambi Province, Sumatra, Indonesia, located 19 km apart and with similar climatic conditions. Average annual temperature in the area was 26.7 ± 0.2 °C, and annual precipitation was 2235 ± 385 mm (1991–2011 mean ± SD63), and a dry season with less than 120 mm monthly precipitation usually occurred between June and September. The first site was a 1-year-old smallholder plantation (1°50′7.6”S, 103°17′44.2”E), where we measured for about 8 months from July 2013. Palms had an upper height of up to 2 m and a trunk height of ~0.2 m during the measurement period, and still did not produce fruits. In this plantation, over 60% of the soil was covered with grasses and seasonal crops25. At the second site (1°41′35.0″S, 103°23′29.0″E), a state-owned plantation (PTPN VI) with a cultivation area of 2186 ha which was 12-year-old at the beginning of the study period, we measured for over 2 years from May 2014. Canopy height was 12 m at the beginning of the study period, and the oil palms were mature and produced fruits, with a mean annual yield of 26.5 Mg ha−1 (2014–2016). Oil palms usually produce their first harvests 3–5 years after planting55,64, and therefore in our calculations we considered yield to be produced from year 4. The PTPN plantation was fertilized with 196 kg N ha−1 per year applied as urea during the years of study. There was hardly any understory vegetation (grasses) as herbicides (glyphosate) were routinely applied to the ground. However, the butts of pruned oil palm leaves along the trunks were densely covered with epiphytes. For additional details on both plantations, see Meijide et al.15.
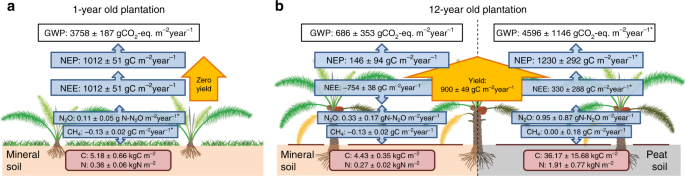
The two plantations were located on mineral soils classified as loam Acrisols63,65. Soil carbon (C) and nitrogen (N) contents for the 1-year-old site were 1.11 ± 0.48 and 0.08 ± 0.03%, respectively (mean ± SD). At the 12-year-old site, most of the soils were mineral (C: 1.12 ± 0.34%, N: 0.08 ± 0.02%). In addition, close to water channels nearby our study site on mineral soil and covering ~5–10% of the eddy covariance tower footprint (see next section for method description), there was an accumulation of organic matter leading to C-rich soils. While C stocks of the upper 30 cm of soil were 5.18 ± 0.66 and 4.43 ± 0.35 kgC m−2 at the 1-year-old and on the mineral soil areas of the 12-year-old study site, they were more than five-times higher (36.17 ± 15.68 kgC m−2) on the peat areas covered by the eddy covariance footprint in the 12-year-old plantation. The terrain was flat with only small elevation variations (±15 m, see Meijide et al.15) at both sites.
Eddy covariance measurements of carbon dioxide
The eddy covariance technique66, which provides integrated measurements over the whole ecosystem, was used to measure net ecosystem carbon dioxide (CO2) fluxes (NEE) in oil palm plantations as explained in detail in Meijide et al.15. Different stages of oil palm development were considered, i.e., measurements were performed in a 1-year-old plantation which was non-productive in terms of fruit yield and in a highly productive 12-year-old plantation. At both sites eddy covariance towers were built (7 and 22 m high for the 1- and 12-year-old plantations, respectively), and a sonic anemometer (Metek uSonic-3 Scientific, Elmshorn, Germany) and a fast response open-path CO2/H2O infrared gas analyser (Li-Cor7500A, LI-COR Inc. Lincoln, USA) were installed at the top of the tower. Both instruments measured at 10 Hz. Data for the 1-year-old plantation were only available for 8 months; to estimate annual budgets, a linear extrapolation of the fluxes to 12 months was performed. In the 12-year-old plantation, fluxes were measured for 24 months; we report the according annual fluxes in our study (Supplementary Table 1). Data were processed using the software Eddy Pro (LI-COR, Lincoln, USA). Fluxes were planar-fit coordinate rotated67, block-averaged and corrected according to Webb–Pearman–Leuning68. Subsequently, data were filtered according to friction velocity, and a footprint analysis was performed following Kjlun et al.69. Gap-filling of meteorological and eddy covariance data were performed considering the co-variation of fluxes with meteorological variables and the temporal auto-correlation of the fluxes70. For further details on eddy covariance data processing at the sites, see Meijide et al.15.
Chamber measurements of soil greenhouse gas fluxes
Soil GHGs fluxes (CO2, N2O and CH4) were measured using static vented chambers16,21. Chamber bases were made of made polyvinyl chloride (0.05 m2), and were inserted ∼0.03 m into the soil. During sampling campaigns, these chamber bases were covered with polyethylene hoods leading to chamber heights of 0.27 m and a volume of 12 l. In each chamber, samples were removed 1, 11, 21 and 31 min after closure, using a syringe through a Luer lock. Samples were stored in previously evacuated 12-ml exetainers (Labco Limited, Lampeter, UK). Samples were transported to Göttingen (Germany), and analysed with a gas chromatograph equipped with a flame ionization detector and an electron capture detector. Additional details on the sampling procedure and analysis can be found in Hassler et al.16,21.
In the young plantation, we installed a total of nine chambers grouped into three clusters located at a maximum of 35 m from the tower and with chambers within each cluster at three different distances to the oil palm trunks (ca. 0.8, 2.5 and 5 m). We performed four measuring campaigns. In the mineral areas of the mature plantation, we selected four replicates at a distance of 50 m. Each replicate consisted of three chambers, located at 0.8, 2.8 and 4.8 m from the base of the according oil palm trunks, leading to a total of twelve chambers21. A total of 45 sampling campaigns were performed over 18 months. In the peat areas of the mature plantation, we installed two additional replicates (sets of three chambers leading to a total of six chambers) where we performed 37 sampling campaigns over 15 months. The installation of chambers at different distances to oil palm trunks aimed at capturing the spatial variation induced by different management practices; in smallholder oil palm plantations, for example, fertilizer is often applied directly next to the trunk.
Annual fluxes were estimated based on trapezoidal interpolation between measured fluxes and the interval between sampling, and summing up interpolated fluxes for the entire year16,21.
Soil respiration in second-rotation cycle plantations
Our direct measurements were restricted to oil palm plantations in their first-rotation cycle after conversion from forest. To estimate soil respiration for oil palm plantations in the second (or subsequent) rotation cycles, we calibrated a decay function from literature with the available measured data on soil respiration and C stocks. The decay function was presented by Van Straaten et al.31, based on soil C analyses in reference forest and 17 oil palm plantations in tropical Asia, South America and Africa. It depicts relative soil C stocks compared with reference forest (100%) from 0 to 40 years after conversion to oil palm. We calibrated the curve to our study region by using the mean soil C stock measured at four study sites in the nearby Harapan rainforest as the 100% reference (5.43 ± 0.43 kgC m−2, Guillaume et al.30). We confirmed that our measured soil C stocks from the 1-year-old and 12-year-old oil palm plantations were within the uncertainty range of the resulting decay function before applying it to derive the equilibrium soil carbon stock under oil palm (reached 30–35 years after conversion), which was 3.26 kgC m−2 (Supplementary Fig. 3a). Estimating the according equilibrium soil respiration was based on the assumption that the relative magnitude of soil respiration after forest conversion follows the same function over time as the previously presented relative soil C stocks (Supplementary Fig. 3a), and thus also reaches equilibrium 30–35 years after forest conversion. We calibrated the curve to our study region by using the measured soil respiration values of the 1-year-old oil palm plantation, as no reference forest measurements were available. Using the measured values of the 12-year-old plantation to calibrate the curve would change the results only slightly due to the small difference between measured mean and the decay curve (Supplementary Fig. 3b). From the calibrated decay function, we derived the equilibrium soil respiration under oil palm for second-rotation cycle analyses, which were 84.7 mgC m−2 h−1 and 825 gC m−2 yr−1 at hourly and annual scales, respectively.
Net ecosystem productivity and global warming potential
In this study, we define positive values as a flux from the ecosystem into the atmosphere, i.e., a source, whereas negative values represent a flux into the ecosystem, i.e., a sink.
NEE estimates from eddy covariance measurements were combined with estimates of C removed from the field during harvest71,72 (Cyield) to determine net ecosystem productivity (NEPC73):
$${mathrm{NEP}}_{mathrm{C}} = {mathrm{NEE}} + {mathrm{Cyield}}.$$
(1)
NEP is positive when C is removed from the system, and negative when C is captured.
For the peat soils in the 12-year-old oil palm plantation, NEE was estimated from NEE measurements on mineral soils and soil respiration (SR) in both types of soils:
$${mathrm{NEEpeat}} = {mathrm{NEEmineral}}-{mathrm{SRmineral}} + {mathrm{SRpeat}}.$$
(2)
For second-rotation cycles, NEE was estimated using the previously explained estimations for SR:
$${mathrm{NEE2}}^{{mathrm{nd}}}_{mathrm{rot}} = {mathrm{NEEmineral}}-{mathrm{SRmineral}} + {mathrm{SR2}}^{{mathrm{nd}}}_{mathrm{rot}}.$$
(3)
The contributions of CH4 and N2O fluxes to the net global warming potential (GWPnet) were calculated using the most recent values for a 100-year time horizon2,74, which are 25 and 298 for CH4 and N2O, respectively; they were added to the previously derived NEP to obtain the total ecosystem GWP:
$${mathrm{GWP}}_{{mathrm{net}}} = {mathrm{NEP}}_{{mathrm{CO2}}} + {mathrm{GWP}}_{{mathrm{CH4}}} + {mathrm{GWP}}_{mathrm{{N2O}}}.$$
(4)
GWP is positive when fluxes are directed away from the ecosystem (emissions).
General assumptions on LCA
LCA is a method to assess the potential environmental impacts of goods and services taking into account their whole-life cycle. It considers all inputs and outputs in terms of energy, raw materials, emissions, residues, etc. at each stage along the life cycle of a given product and assesses their potential impacts by applying different impact assessment methods. LCA is standardized by the International Organization for Standardization (ISO) norms 14040:200675 and 14044:200676, which serves as the framework for LCA studies.
In traditional LCA, biofuels are considered to be C neutral, i.e., the C absorbed through photosynthesis and fixated into biomass equals the C which will be released during biodiesel combustion and any other biogenic product38. Only few previous studies have diverged from the assumption of C neutrality38,50,77 due to a lack of field- measurement-based flux data. To our knowledge, no LCA of palm-oil biodiesel has applied measured GHG emissions prior to our study.
Functional unit for the LCA analysis was 1 MJ of palm-oil biodiesel. The geographical horizon of the analysis was Jambi province (Indonesia), where the palm-oil and biodiesel production were based. In order to be able to compare our results with the reference values given by the renewable energy directive of the EU2, the GWPs published in the directive were used to calculate the midpoint impact of each GHG. The system boundaries included cultivation, milling and biodiesel production stages (Supplementary Fig. 5). For the scenarios analysed in our study, the analyses are based on time-limited data from the young and mature plantations where GHG fluxes were measured, which have been used to perform estimations for the plantation life cycle. In contrast to traditional LCA, measured CO2 uptake as well as GHG emissions during different stages of the cultivation phase (see previous sections for method descriptions) were included in the analysis. CO2 emissions from the combustion of the fibres, shells, the CH4 collected in the mill as well as the biodiesel were also considered in the analysis. Asides from biodiesel, several co-products are obtained along the system. In order to solve this multifunctional system, allocation by energy was applied75,76. Primary data were used for the LCA whenever available, while data from the ecoinvent database v378 were used as background data. Where large divergences to ecoinvent datasets were apparent from previous work in the study region, single values were adjusted to better describe the processes in Indonesia (Supplementary Table 4). The analysis was conducted using the software SimaPro 879. A sensitivity analysis based on economic revenue was conducted for the business-as-usual scenario for first-rotation oil palm plantations, to evaluate how this methodological approach would affect our results in comparison with our methodology using allocation by energy. We used biodiesel prices established by the Indonesian Ministry of Energy and Mineral Resources (7358 IDR l−1) and crude palm oil prices for the port of Medan (7038 IDR kg−1). Prices for glycerine, palm kernel cake and palm kernel oil were 500, 120 and 765 US $ t−1, respectively. Biodiesel and crude palm oil were responsible for 76.6 and 97.4% of the revenues in the production and oil extraction process, respectively. Differences in net GHG emission or in any of the processes between our LCA with allocation by energy and the analysis based on economic revenue were small (see Supplementary Table 3).
Considerations on oil palm cultivation and harvesting
For the LCA, oil palm cultivation begins with the first stages of plantation establishment at the nursery, where the seeds are grown until they can be transferred to the field. In our business-as-usual scenario, we assume that palms did not produce fruits until the fourth year, and that maximum productivity was reached after 8 years. During the first years, the site was treated with low amounts of agrochemicals and fertilizers (we assume fertilization rates as observed for smallholder plantations in the study area65 for the calculations, i.e., 88 kgN ha−1 yr−1, 73 kgK ha−1 yr−1 and 38 kgP ha−1 yr−1). Fluxes, fertilization and herbicide application rates were considered constant during the first 3 years of cultivation, and to then linearly increase until a plantation age of 8 years, from whereon they remain constant. On the 8th year, when palms have reached maturity and leaf area index reached (near) maximum values24, we also assume a plateau in NEE fluxes and yield (Supplementary Fig. 4) as well as fertilization and herbicide application rates until the end of the life cycle (i.e., 196 kgN ha−1 yr−1, 220 kgK ha−1 yr−1, 50 kgP ha−1 yr−1 and 2250 ml Glyphosate ha−1 yr−1; see Supplementary Table 4 for fertilizer and herbicide levels along the plantation life cycle). After 25 years, although the oil palms may still be productive55,56,57, a new rotation cycle is commonly initiated due to the increasing difficulty in harvesting operations with further increasing palm height. Over the 25-year life cycle, the simulated mean of fresh fruit bunches (FFB) yield was 21925 kg ha−1 yr−1 (including the first three non-productive years and taking into account the above-described considerations in yield development over plantation age); these values fall into the upper range of life-time FBB yield values reported in previous studies32,33,34. As we did not directly measure FFB yield in our study, the simulations were based on the data as reported by the management of the studied mature plantation (the young plantation did not produce fruits yet). The average applied fertilizers were 174.4, 190.6 and 47.6 kg ha−1 yr−1 for N, K and P, respectively. Glyphosate was applied at 1800 ml ha−1 yr−1 (Supplementary Table 4). For the LCA calculations, we assume that all fertilizers were produced in Sumatra and that only inland transport by truck occurred27.
Crude palm oil production in LCA
After the FFBs were harvested in the mature plantation, the young plantation did not produce fruits yet, they were transported to the palm-oil mill located in Bunut, Sumatra (~25 km from the plantation). The mill was launched in 1996 and processes ~232,000 Mg FFB annually80. The FFBs first go through a sterilization process. Then the fruits are separated from the FFBs, leaving empty fruit bunches (EFBs). The EFBs are mixed with the palm oil cake (pulp left after extracting the oil from the kernel), and are applied in the plantation as natural fertilizers, thus returning the C to the soil. Before the milling process, the fruits enter in a digester and oil is obtained together with palm kernel meal81. To produce one kg of CPO, 5.18 kg of FFB are needed33. The energy required in the whole process is provided by a boiler fuelled with the fibres and shells. CO2 emissions from this combustion were calculated taking into account the water content and C content of each part. Fibres and shells have 40 and 35% water content and 47.2 and 52.4% C content, respectively33.
During the production process, waste-washing water with high organic content, also referred to as palm-oil milling effluent (POME), is generated. In the waste water treatment process POME undergoes anaerobic degradation processes in a closed system82, during which CH4 is produced, which is recovered. Hypothetically, the CH4 could be used to generate electricity the surplus of which could be sold to the national grid, as it is currently being encouraged by the Indonesian government62. However, due to the lack of adequate electricity infrastructure in the study region, this is still not a common practice (<10% of Indonesian mills treat their POME using biogas technology62), and therefore we did not consider this alternative in our study. Instead, we consider that the biogas was burned, thus being released to the atmosphere as CO2 emissions. If the CH4 were to be directly released into the atmosphere without burning, or POME would be stored in open lagoons, where large amounts of CH4 are produced, emissions from palm-oil biodiesel would increase considerably due to the high GWP of CH4 (25 times higher than that of CO2)20.
Transesterification process in LCA
Biodiesel is produced from CPO in a plant located in the south of Sumatra. We assume a distance of 250 km for the CPO transport. The transesterification of CPO into biodiesel requires the use of methanol and sodium hydroxide and electricity as an energy source. The electricity is supplied by the Sumatran power grid; almost 90% of its electricity is produced from fossil fuels83. The biodiesel yield considered in this study is 95% of the CPO33. Besides biodiesel, the plant produces glycerol as a secondary product. Heating values of 37.5 MJ kg−1 and 16 MJ kg−1, respectively, were used to allocate the results84,85. The C content of palm-oil biodiesel amounts to 76.35%78.
Description of business-as-usual and alternative scenarios
We first conducted a traditional LCA for first-rotation oil palm plantations following the common assumption of C neutrality, where any biogenic CO2 emissions occurring along the life cycle are not considered as they are assumed to correspond to the CO2 captured by the plant during the cultivation phase. Next, an enhanced LCA was conducted for the business-as-usual scenario (25-year rotation cycle, mineral soil, first-rotation oil palm plantation), based on the previously described field measurements of GHG fluxes in different cultivation phases. Additional biogenic CO2 releases in the different phases of the life cycle were included in the LCA to ensure a closed C cycle. This included CO2 emissions from the use of fibres and shells to produce the in-house energy required for the oil milling process as well as emissions from the combustion of POME and biodiesel.
Three additional scenarios were included to analyse the potential of adaptions in oil palm management to minimize GHG emissions in first-rotation oil palm plantations. We extended the plantation life cycle to 30 and 40 years (Scenarios A and B, respectively; Supplementary Table 4), maintaining the age at which palms start producing yield and reach maximum yield from the business-as-usual scenario (4 and 8 years, respectively). We analysed an additional scenario (C), where we assumed a rotation cycle of 30 years as well as the use of a (hypothetical) earlier-yielding variety compared with the other scenarios; this variety was assumed to start yielding fruits and to reach (near) maximum yield when 3- and 6-year-old, respectively (Supplementary Table 4). More details on the characteristics and applied parameters of each scenario can be found in Supplementary Fig. 4 and Supplementary Table 4. We additionally analysed these same scenarios, but for second-rotation cycle oil palm plantations, keeping all the parameters as in first-rotation oil palm plantations, but excluding land-use change-related emissions and updating NEE along the plantation cycle (Fig. 4; Supplementary Fig. 4; Supplementary Table 4).
Land-use change-related emissions
We calculated CO2 emissions due to C stock changes caused by land-use change during land clearance before cultivation (ELU, kg CO2-eq. ha−1 yr−1) following the methodology described by the European Commission86, where:
$${mathrm{E}}_{{mathrm{LU}}} = left( {frac{{{mathrm{CS}}_{mathrm{R}} – {mathrm{CS}}_{mathrm{A}}}}{T}} right)x3.664.$$
(5)
CSR and CSA are the C stocks per unit of area associated with the reference land use in kg C ha−1, (land prior to conversion to bioenergy crop plantation) and the actual land (land use for bioenergy crop plantation), respectively. T is the time period of land being used after conversion (i.e., plantation life cycle), and 3.664 is the conversion factor for mass carbon to mass carbon dioxide (CO2).
We used measured values of C stocks within the area of study (283.5 ± 12.2 and 109.9 ± 5.5 MgC ha−1 for forest and oil palm plantations, respectively)30, which included C stocks in the above and below-ground vegetation as well as in the soil. The annualized emissions were calculated taking into account the net C stock (difference between C stocks of the land before conversion and C stocks of oil palm plantations). In our main analysis and results (Figs. 2 and 3), we considered that the land was converted from forest to oil palm plantation as this is the reference land-use in the region. However, many plantations in the area are converted from rubber agroforestry systems or monocultures60, which would lead to lower emissions. In our analysis (Figs. 2 and 3), we further included the hypothetical CO2 uptake that the original land use prior to the conversion (forest) would have had if it would have not been converted (referred to as ‘foregone sequestration’)39. We used NEE data from 3 years in a rainforest in Malaysia51, which amounted to −124 ± 13 gC m−2 yr−1. At this site, NEE was measured with the eddy covariance technique66, i.e., the same technique we used to measure NEE in our study. This is the closest rainforest site to our study sites for which eddy covariance data are available.
Statistical analyses and data
For analysis of differences in measured soil GHG emissions between 1- and 12-year-old plantations on mineral soils and between mineral and peat soils in the 12-year-old plantation, we use linear mixed effect models using the site as fixed factor (see Hassler et al.16,21 for detailed description). We further performed the Mann–Whitney U test to evaluate significant differences between the means.
We performed Monte Carlo simulations to evaluate uncertainties of our LCA for all scenarios (Fig. 2; Supplementary Fig. 6) with SimaPro 8. Herein, we used data distribution information from the ecoinvent database v378 for the background data and standard errors from our measurements for the measured data included in the simulations. The Ecoinvent database provides uncertainty information for all datasets based on the pedigree matrix87,88. The parameter uncertainties cover both the data inaccuracy and the lack of representative data. Uncertainty factors can be translated through the pedigree matrix, which includes six indicators and define different scores based on how the indicator is fulfilled. The following six categories are covered: reliability, completeness, temporal correlation, geographical correlation, further technological correlation and sample size. In our LCA, we report as uncertainties the 25 and 75 percentiles from 1000 iterations in the Monte Carlo simulations.
For NEE fluxes, we assumed a normal distribution of the data with a standard deviation of 5% of the measured value; we chose 5% because it was the maximum error obtained from a bootstrapping approach15 of cumulative water fluxes (which have a close relationship with NEE) from the same oil palm plantation, measured with the same eddy covariance tower15.
All further statistical analyses were carried out with R studio version 3.1.189. Plotting was mainly carried out with R studio, but some figures were produced using Microsoft Excel version 14.0.6112.5000 and the LCA figure was produced using the online-tool SankeyMATIC (sankeymatic.com/). Some figures were further modified using Inkscape Project (version 0.92.4, inkscape.org).
Source: Ecology - nature.com

