Fig. 1(a) shows the schematic diagram of the cell fabricated to test the CSMFC using coin-cell type (CR 2032) system, which is normally used for battery study. The coin cell has typical dimensions such as a thickness of the cell is 0.20 cm, diameter 0.32 cm, the surface area of the coin cell is 3.14 cm2 26,27,28. Graphite electrodes are used as an anode and cathode separated with compost soil. Fig. 1(b) shows a photograph of the real testing unit used in this study. The surface texture of the soil was studied using SEM measurements is shown in the supplementary information Fig. S2. The detailed experimental procedure is provided in the experimental section.
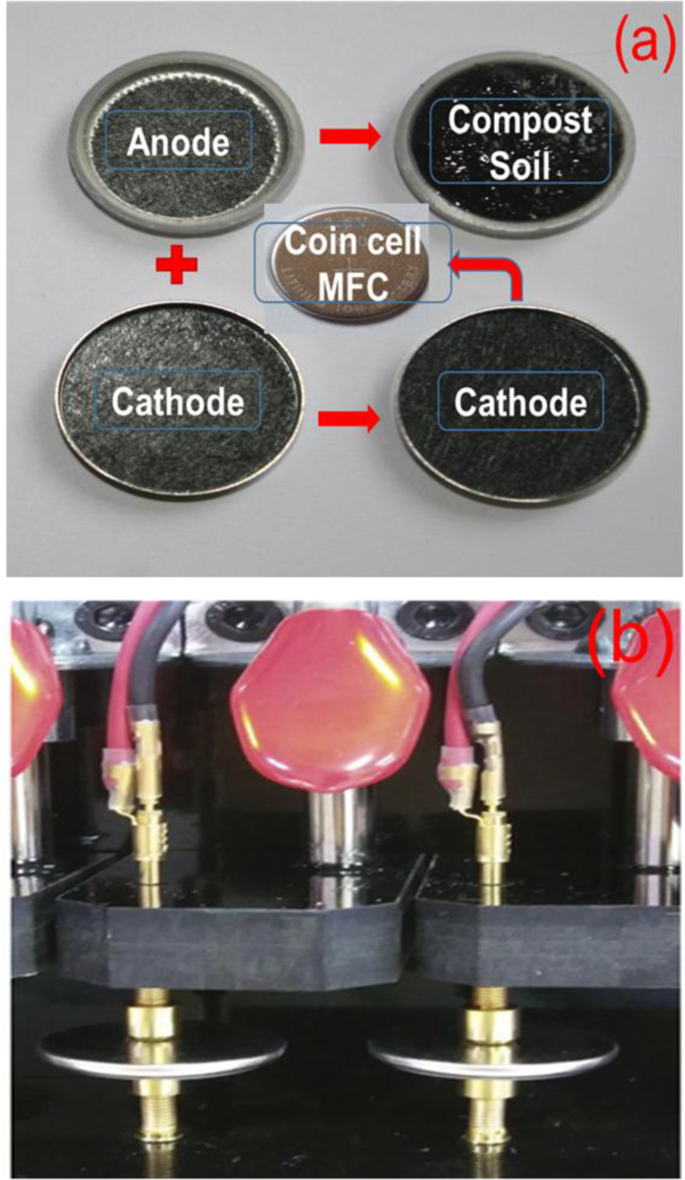
(a) Schematic illustration of the coin cell system used to study compost soil microbial fuel cell, (b) Actual photograph of the measuring system used.
Fig. 2(a) shows the cyclic voltammograms of CSMFC with different urea concentrations, at a scan rate of 50 mV/Sec. The urea concentration in CSMFC is varied from 0.1 g/ml to 0.5 g/ml. The optimisation of the CSMFC is addressed by considering peak current and onset potentials during the oxidation and reduction process. The electrocatalytic activity was highest at a concentration of 0.5 g/ml of the urea fuel. This result indicated that urea fuel affects the compost soil directly for power. However, the redox potential peak for urea in the bipolar measurements fell in the range between 0 to ±0.6 V. It is similar to the values reported in the literature for urea, urine and near to ammonium redox potentials4. Urea and ammonium, ions both related to each other as sources of nitrogen4.as mentioned in the soil process of nitrification and denitrification of the compost4 Fig. 2(b) shows CV curves of the CSMFC prepared at a urea concentration of 0.5 g/ml at a different scan rates ranging from 5 mV/sec to 50 mV/sec. It revealed that the urea sample has scan-rate dependent behaviour. With an increasing scan rate, the current density also enhances. The device changed from quasi-reversible to a constant state showing positive polarity. The scan rate, showing the electrochemical reaction on the active electrode surface, occurred due to a diffusion-controlled process, according to the Randles-Sevcik model4,22,23. Thus, the system is suitable for both the power generation purpose and cleaning urea related waste materials. Urea as fuel in 0.5 g/ml compost-based, sample selected for further studies. The linear increase of power with respect to the scan rate and concertation of the CSMFC similarly like typical MFC.
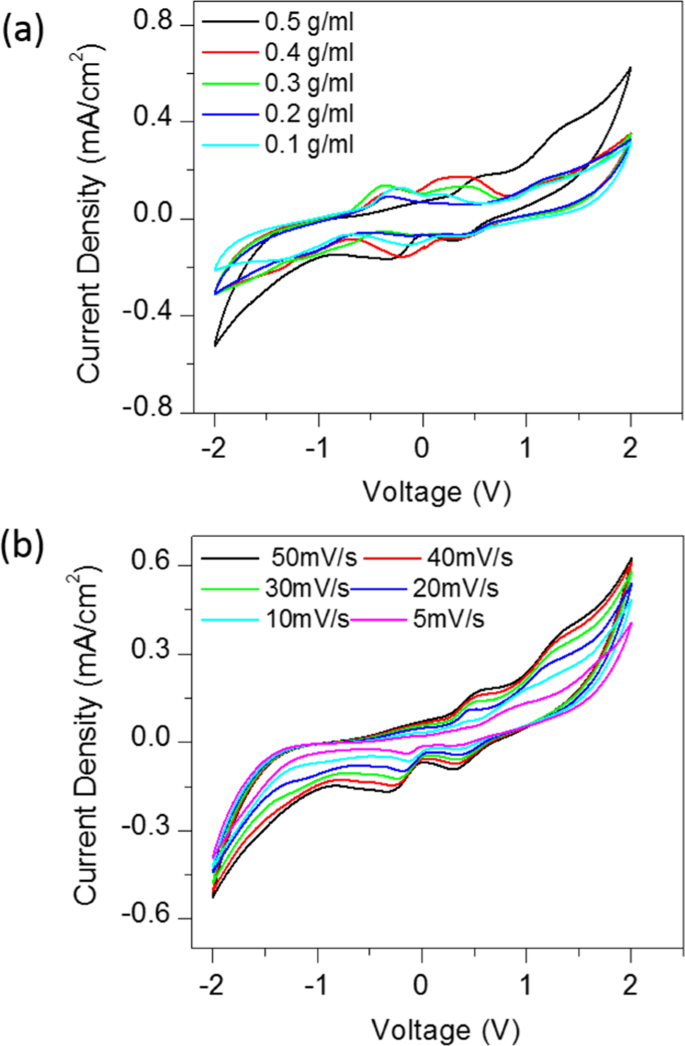
(a) Bipolar CV studies shows the effect of the urea fuel concentration on compost soil (b) CV curves with various Scan rates.
Electrochemical impedance spectroscopy (EIS) measurements are further performed to investigate the electrochemical behaviour of the soil compost with urea as fuel. The real and imaginary impedance was obtained for a frequency range of 0 Hz to 10,000 Hz for the applied active field. Fig. 3(a) shows Nyquist plots of CSMFC prepared at different concentrations follows a similar trend observed in the CV results. Lower impedance has higher redox potential and vice- versa. The slope of the straight line explained the mechanism in the low-frequency regions. It shows the role of Warburg impedance (W), which corresponds to the electrolyte diffusion in the urea-based material for the soil sample. The intersection of the curve from CV measurements at the real part of Z/Ohm shown in Fig. 3(b) representing the solution resistance (RS), the small semicircle in the enlarged view of the impedances region shows the charge transfer resistance (RCT) between the working electrode/electrolyte interfaces. Additionally, RCT depended upon the concentration of urea. The lowest impedance was observed at a level of 0.5 g/ml. Thus, lower the urea concentration level higher was the impedance4.
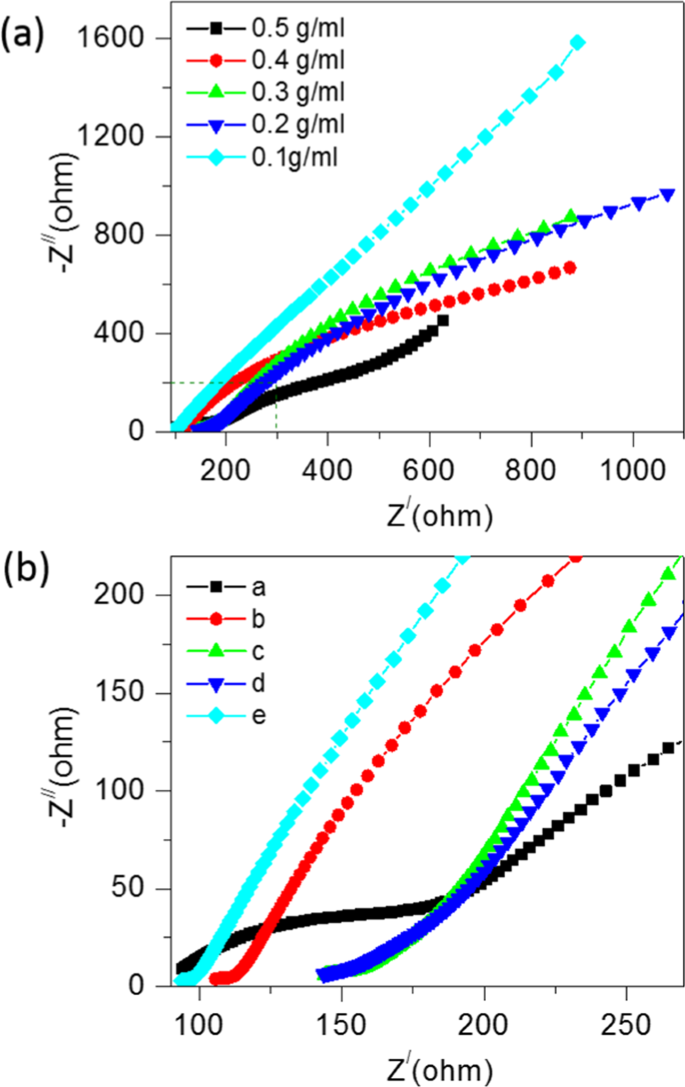
(a) EIS study to show the effect of the urea fuel concentrations with compost soil (b) Enlarged view of the EIS curves of the compost soil samples.
The cyclic stability study performed for the optimisation of CSMFC prepared at a urea concentration of 0.5 g/ml. Fig. 4(a) shows the CV curves recorded for 500 cycles using a single shot of 0.5 g/ml urea fuel in compost sample. All the experiments of the stability test are performed at room temperature. The reversible behaviour of the CV curves without a change in the shape suggests the outstanding stability of the CSMFC for over 500 cycles. Fig. 4(b) shows the Nyquist plot of CSMFC showing the electrochemical behaviour before and after 500 cycles. The slope of the straight-line portion in the low-frequency region shows the Warburg impedance (W), the semicircle in the high-frequency region shows the RCT at the working electrode-electrolyte interface that is caused by the faradaic-redox reaction of the electrode. After 500 cycles, RCT increased significantly, which correlated with the structural degradation of the urea fuel cell. During the cycling process. The cell gradually comes at dry state after completing 500 cycles, causing an increase of impedance. Due to gradual urea fuel degradation, the power peak declines and the cell impedance increases.
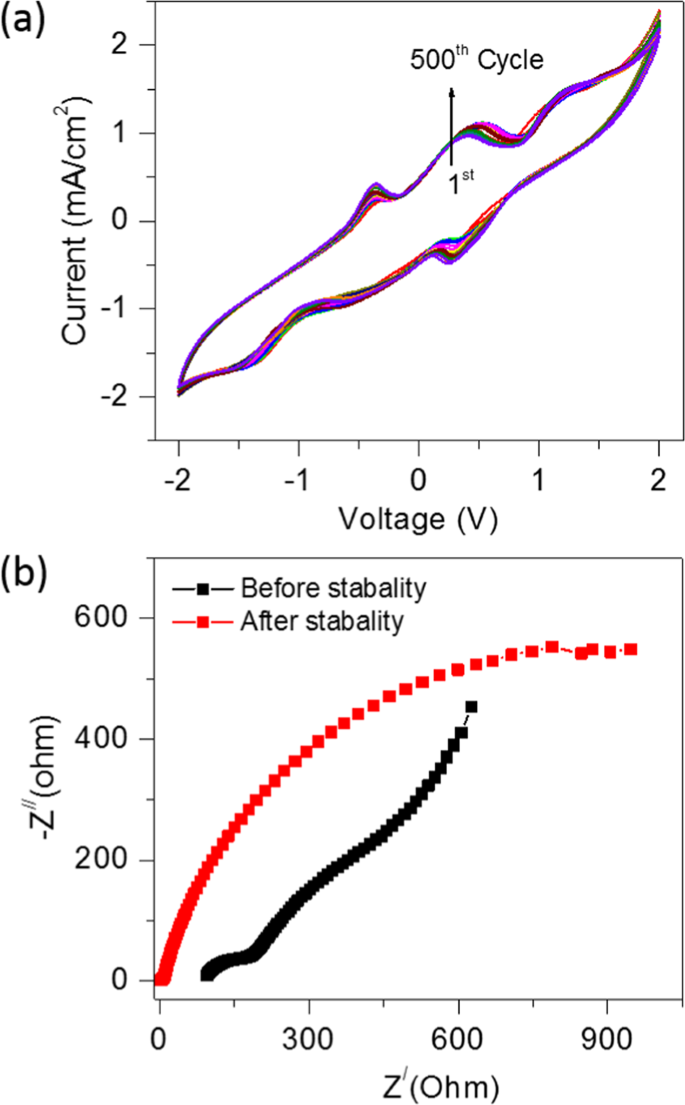
Cyclic stability of the compost soil with single shot of fuel (a) Cyclic stability plotted for 500 cycles (b) EIS studies before stability and after stability for 500 cycles.
The I–V measurements were performed from 0 to 28 hours to study the electrocatalytic activity of the CSMFC prepared by using different urea concentrations. Fig. 5(a,b) shows a power density curve with respect to the operation time and IV curves of CSMFC. It is seen that the CSMFC activated nearly about 14 hours generating maximum power. It also noted that the power density increases with increase in the urea concentration from 0.1 to 0.5 g/ml. The maximum power density is found to be 3.16 mW/m2 at 0.5 g/ml of the concentration. At mass transport region (i.e. higher current) the value of voltage is low, and inactivation region(i.e. low current) the value of voltage is higher giving low power densities whereas, in the ohmic region, the power density is at its maximum value hence the power density curve symmetrical. Although the power density obtained in this study is inferior to the other systems reported in the literature, this is an entirely new system such as CSMFC unlike to the liquid-based MFCs1,2,3,4,5,6. On the other hand, it has some other advantages such as it is sustainable, reusable, non-toxic, cheap, eco-friendly and available easily on the Earth crust.
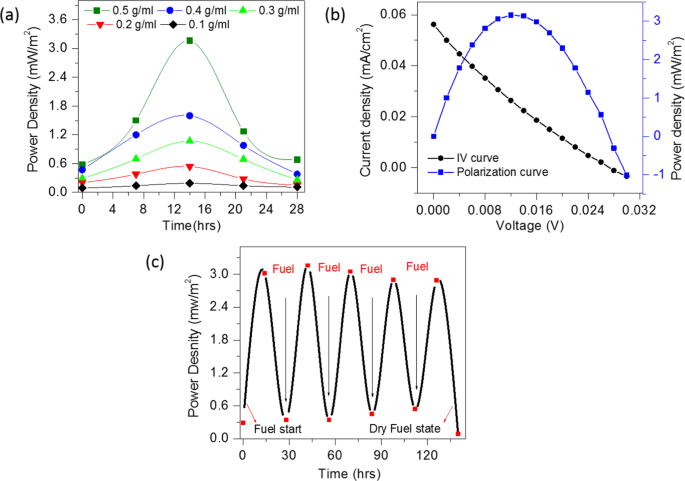
Gr/Gr Electrodes Keithley (I–V) measurement data (a) Urea fuel concentration variation 0.1 g/ml to 0.5 g/ml with compost soil coin cell samples (b) Polarization curve of the CSMFC (c) sustainability study of the CSMFC prepared at 0.5 g/ml urea fuel.
The CSMFC has been refuelled several times after every 28 hours and power generation was monitored to assess its stability. The results showed the stable functioning of the cell for the measured period of up to 140 hours. In order to study the consumption of urea, we also performed IV measurements in which urea was injected as fuel in regular interval of time and its power density is calculated. Please see following Fig. 5(c) of generated power density versus time. Initially, we have injected urea fuel and left for the activation. It is seen that it was activated after 14 hours after fuelling, showed maximum power, then after power decreases. After refuelling it in 2nd cycle with urea, the power again increased to its maximum. This clearly indicates that the urea is consumed in CSMFC to generate power.
The chronoamperometry, study was performed for the optimisation of the durability test for soil compost sample with a single shot of urea 0.5 g/ml fuel at 0.3 V. While constantly monitoring the sample Fig. 6 shows that the electro-oxidation activity of the compost soil sample reached a maximum current density of (0.15 mA/cm2). The current slowly decreased by urea oxidation. In order to know the activity of the bacteria and enzymes present in the compost, we prepared CSMFC using autoclaved compost (which kills the bacteria and enzymes). The sample was autoclaved at 120 °C killing the bacteria and enzymes from the compost. From the Fig. 6, it is seen that the current was gradually decreased to 0.012 mA at 0.3 V, as compared to the standard compost sample, which was ten times lesser than that of the soil compost. The comparison shows that the bacterial effect involved in the loss of the current in the autoclaved sample.
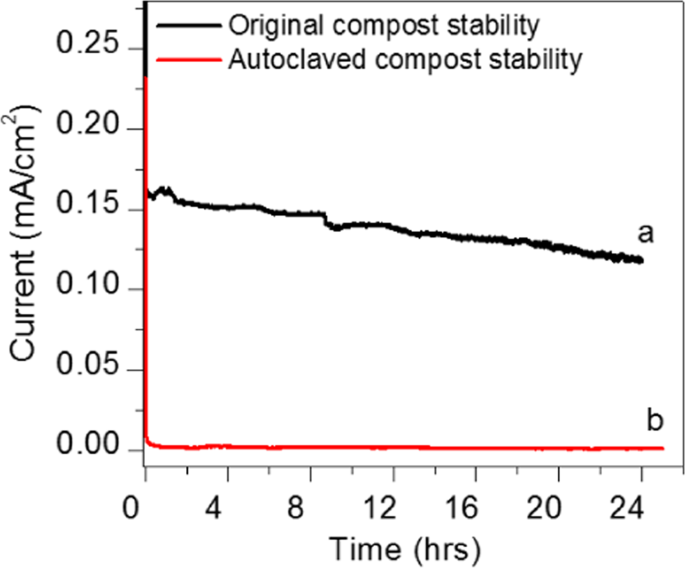
Comparsion durability test at 0.3 V between standard compost sample and autoclaved sterilization at (120 °C) treated compost sample.
In the bacterial studies, compost soil demonstrates the role of bacteria and enzymes in the functioning of the CSMFC. The compost soil sample was sterilised by autoclave treatment, and the power generated by these cells were compared with those that were not sterilised. Fig. 7(a), while the first sample contained bacteria, from the CSMFC. Fig. 7(b) The second sample that was autoclaved at 120 °C contained no live bacteria. This was evident from Fig. 7(a),(b), which shows the bacterial growth in agar plates after 28 hours. While bacterial colonies were visible in the plates, as shown in Fig. 7(a) and no colonies were found in the autoclaved sample shown in Fig. 7(b). These results suggest the role of bacteria and enzymes in enhancing electricity generation in the CSMFC. Fig. 7(c) shows the Keithley (I–V) measurements. The CSMFC showed a maximum power density of 3.16 mW/m2, and the autoclave treated sample was only 0.03 mW/m2. Thus this study clearly indicated the role of urea in power generation, due to the effective role of soil in CSMFC2,19. The similarity in the results obtained from bacterial studies and (I–V) measurements suggesting that bacteria, enzymes played an essential role for the power generation. The plates were photographed, and the soil bacteria were examined for a longer time up to 84 hours (see Supplementary Information Fig. S3).
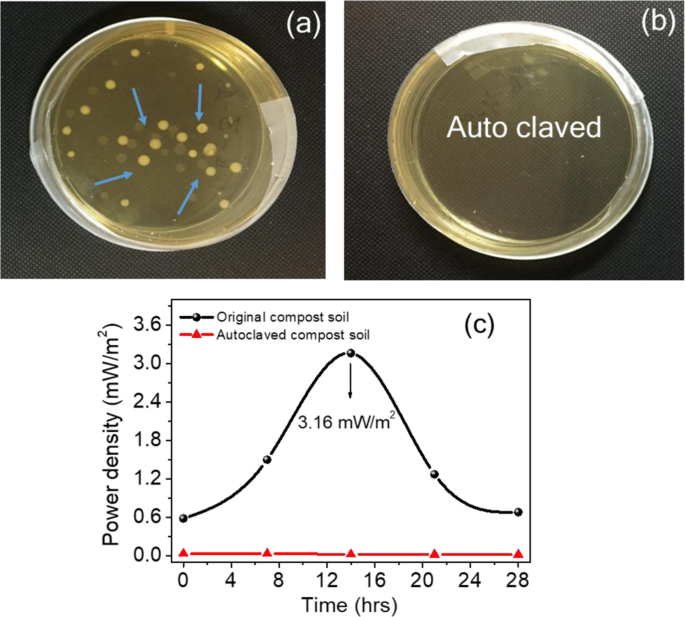
Effect of the bacterial study for compost soil coin samples (a) Growth of the bacterial colonies present (b) Growth of colonies absent (c)The (I–V) study showing the effect of the bacteria.
In the mechanism, the soil is known to act as an electrocatalyst4. Similar to bacteria and enzymes, the soil may also catalyse the oxidation of urea. Due to the addition of the nitrogen in the soil, the chemical reaction enhances the pH from 5.5 to an alkaline pH in the range of 8–9. The Vmax for the high-affinity response reaction (N2O → NO → N2) showed a relatively small peak at pH 6.5, followed by first a decline and then a sharp increase in the pH to 9.520. Urea is food for the bacteria; urea stimulates bacteria to release urease19,24. When urea was hydrolysed, it generates ammonia, ammonium ions (NH4+ ions). Compost soil performs ammonification through nitrification and denitrification process to reach to release (N2) as the last product while supplying protons and electrons. When urea was hydrolyzed in the soil releases the urease enzyme, it generates ammonia, ammonium ions (NH4+ ions) later. Following this, ammonification and volatilization lead to nitrification and denitrification process2,3,19.
Reaction 1 converts ammonia to the intermediate, hydroxylamine, and is catalyzed by the enzyme ammonia monooxygenase. Reaction 2 converts hydroxylamine to nitrite and is catalyzed by the enzymes hydroxylamine oxidoreductase29.
The operating mechanism of CSMFC is given below,
Anode reaction
Urea releases the urease enzymes by hydrolysis case A and the role of urea in compost soil mechanism, as mentioned below in case B.
$${rm{A}}),{rm{CO}}{({{rm{NH}}}_{2})}_{2}+6{{rm{OH}}}^{-}to {{rm{N}}}_{2}+{{rm{CO}}}_{2}+{{rm{5H}}}_{2}{rm{O}}+6{{rm{e}}}^{-}$$
$${rm{B}}),{rm{CO}}{({{rm{NH}}}_{2})}_{2}+{{rm{H}}}_{2}{rm{O}}to 2{{rm{NH}}}_{3}+{{rm{CO}}}_{2}$$
$${{rm{NH}}}_{3}+{{rm{O}}}_{2}+2{{rm{e}}}^{-}to {{rm{NH}}}_{2}{rm{OH}}+{{rm{H}}}_{2}{rm{O}}$$
(1)
$${{rm{NH}}}_{2}{rm{OH}}+{{rm{H}}}_{2}{rm{O}}to {{rm{NO}}}_{2}^{-}+5{{rm{H}}}^{+}+4{{rm{e}}}^{-}$$
(2)
$${{rm{NH}}}_{4}^{+}+{{rm{NO}}}_{2}^{-}to {{rm{N}}}_{2}+2{{rm{H}}}_{2}{rm{O}}$$
Cathode reaction
$${{rm{NH}}}_{3}+{{rm{H}}}_{2}{rm{O}}to {{rm{NH}}}_{4}^{+}+{{rm{OH}}}^{-}$$
The overall reaction for anode and cathode
$$2{rm{CO}}{({{rm{NH}}}_{2})}_{2}+3{{rm{O}}}_{2}to 2{{rm{N}}}_{2}+2{{rm{CO}}}_{2}+4{{rm{H}}}_{2}{rm{O}}$$
The equations confirmed the combined mechanism for both compost soil and urea fuel enhances the power generation. Due to urea fuel in liquid state dissolved in compost soil so that bacteria and enzymes uptake, then generate electricity in the CSMFC.
Either urea or urine can be directly used as fuels to produce power in fuel cells without a membrane or with membrane1. Oxidation of urea to nitrogen gas, carbon dioxide results in the generation of ammonia or ammonium ions, which are converted to carbamate or carbonic acid CO (OH)2, as reported in the literature. In the process of ammonification, ammonium ions can be oxidized by two classes of bacteria (Nitrobacter and Nitrosomonas) to NO3 (nitrate) with an unstable intermediate NO2 (nitrite) in a process called nitrification, which eventually produces nitrogen (N2)4,19,20,24. This study confirmed that urea has a profound effect on the power generation from the CSMFC. Our focus is to get power from the compost soil process in future by using waste like urine, industrial wastewater, which contains much amount of urea. However, the real composted feedstock contains diverse components other than urea, which may slightly vary the power generation results.
Source: Ecology - nature.com