RNA sequencing
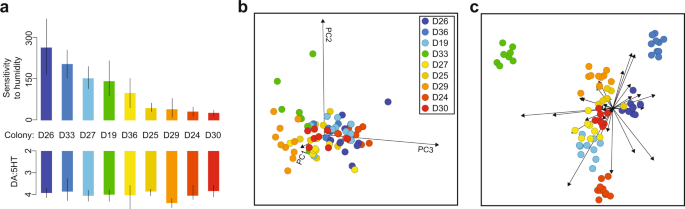
Foragers were collected from nine P. barbatus colonies near the site of a long-term study of this species in Rodeo, New Mexico52. The same colonies were used in previous behavioral observations and pharmacological experiments28. In previous work, we measured for each colony (1) the sensitivity of foraging activity to humidity as the reduction in foraging trips made per day per % decrease in daily relative humidity, and (2) average forager brain DA:5HT ratio, measured with high-performance liquid chromatography28,54. Foragers were identified when leaving the nest mound walking in a straight line, carrying nothing, in a direction used by other foragers that day28. Ants were collected by aspiration and placed directly into liquid nitrogen. Foragers were collected from all colonies within 2 hours on the same morning (9/4/2017). The same collection of ants was used for gene expression quantification in this analysis as for the measurements of forager brain DA:5HT from these colonies28.
For RNA sequencing, single-forager brains were dissected out in a fresh buffer of cold RNAlater and placed into Trizol on dry ice55. Total RNA was extracted from whole forager brains, and RNA-seq libraries were prepared by Novogene using the following protocol. From each single brain, <1 µg of RNA was used for cDNA library construction using the NEBNext Ultra RNA Library Prep Kit for Illumina (cat# E7420S, New England Biolabs, Ipswich, MA, USA) according to the manufacturer’s protocol. rRNA was removed using the Ribo-Zero kit. The mRNA was fragmented randomly by adding fragmentation buffer, then cDNA was synthesized by using mRNA template and random hexamers primer, after which a custom second-strand synthesis buffer (Illumina), dNTPs, RNase H and DNA polymerase I were added to initiate the second-strand synthesis. Next, after a series of terminal repair, ligation, and sequencing adaptor ligation reactions, the double-stranded cDNA library was completed through size selection and PCR enrichment. The resulting 250–350 bp insert libraries were quantified using a Qubit 2.0 fluorometer (Thermo Fisher Scientific, Waltham, MA, USA) and quantitative PCR. Size distribution was analyzed using an Agilent 2100 Bioanalyzer (Agilent Technologies, Santa Clara, CA, USA). Qualified libraries were sequenced on an Illumina HiSeq 4000 Platform (Illumina, San Diego, CA, USA) using a paired-end 150 run (2 × 150 bases). Around 20 M raw reads were generated from each library. Sequencing outcomes per library are available in file “NovogenePbarSeqQC.xlsx”. Ten brains from each of the nine colonies were sent for sequencing. Five samples were discarded before the library preparation phase, resulting in n = 85 high-quality single-forager brain transcriptomes.
Bioinformatics
The P. barbatus genome and transcriptomic resources were downloaded from NCBI (GenBank accession: GCF_000187915.156). Previous brain-specific RNA-seq data were used to improve gene models in this NCBI assembly28 (Bioproject: PRJNA277638).
Candidate gene lists were constructed for three categories of P. barbatus neurotransmitter-related loci: metabolic enzymes, GPCR receptors, and transporters. The list of candidate biogenic amine receptors was found by querying dopamine, histamine, octopamine, tyramine, and serotonin receptors from Drosophila against the P. barbatus proteome. The list of transporters was generated by finding all P. barbatus homologs of neurotransmitter receptors identified in Drosophila57. In all cases, the Drosophila melanogaster protein sequence was used as a BLASTP query against the P. barbatus genome and an E value cutoff of 0.01 was used. The list of biogenic amine metabolic enzymes was generated by finding all P. barbatus homologs of the canonical invertebrate biogenic amine-metabolizing enzymes16,38,39. To avoid user bias in the construction of candidate gene lists, the lists were finalized before calculating associations with colony traits, and all relevant genes from recent review papers were used as queries against the P. barbatus proteome.
RNA-seq read quality was assessed using MultiQC58. Adapter sequences were removed using cutadapt59 with standard settings. Reads were aligned to the P. barbatus transcriptome using STAR60 allowing for two sequence mismatches per read (to accommodate potential genetic divergence between the sampled populations and the reference). Gene-level counts were extracted using Rsubread61 and the P. barbatus annotation GCF_000187915.1_Pbar_UMD_V03_genomic.gff56. Raw counts were converted to transcripts per million (TPM) for downstream analyses. We controlled for potential sequencing batch effects in R with ComBat62, using sequencing run, RNA concentration (via qubit measurement), and library number as potential effects. Gene expression characteristics such as overall expression level and extent of variability among samples are known to be associated with distinct evolutionary patterns. For use in downstream analyses, for each locus we calculated the median expression level (Median TPM), and expression variability (Standard deviation among all samples).
PCA and linear discriminant analysis (LDA) were carried out in Orange 3.20 (workflow available). A PCA was calculated on an expression matrix where columns correspond to samples, rows correspond to loci in the P. barbatus transcriptome, and cell values were expression values in TPM. Thirty principal component dimensions were retained for the LDA, with colony used as a stratifying factor.
We tested for correlations of gene expression level with two measures of colony traits, described above: (1) sensitivity of foraging activity to humidity, and (2) forager brain DA:5HT. Correlations were calculated in two different ways: a measure of a colony trait with colony average expression regression (N = 9 points), and a measure of a colony trait with per-sample expression level (N = 85 points). The coefficients of expression-trait correlations were in good agreement in the two methods (Supplementary Fig. 3, p < 0.0001 for both traits). We performed downstream quantitative analysis with the N = 85 single-brain level regression slope estimates, because correlation coefficients calculated with the single-forager expression levels had more accurate estimates of slope and variance owing to the larger sample size, and better captured the subset of genes that had stable linear expression patterns associated with colony trait variation (Supplementary Fig. 3).
GO term analysis used an omnibus p value approach to find functional enrichment of loci that were correlated with traits. First, for each gene we obtained associated GO terms using GO FEAT63. To derive an omnibus p value for GO term enrichment, we calculated gene set enrichment statistics for the top 50–99% of the loci with expression correlated to colony traits using a Fisher’s exact test, then repeated the test by restricting the set of associated loci with increased stringency by 5% steps (e.g., top 50% of loci, then top 45%, top 40%, etc.) and combined the resulting p values using Fisher’s method. We used a cutoff of post-correction omnibus p value of < 0.05 for GO term enrichment and did not consider GO term enrichments when a given gene set had fewer than 10 annotated sequences. The resulting omnibus p values should reflect gene sets that are consistently enriched in the tails of the colony trait correlation distributions at varying levels of stringency, as opposed to single cutoffs as is commonly used. This process should thus filter out potential false-positive associations and highlight GO terms that strongly vary with colony traits.
WGCNA analysis
Data pre-processing and batch correction
All data pre-processing and coexpression network analysis was done in R64. Raw TPM values were processed to remove genes with no variance across samples, low median expression (TPM < 0.5), or no expression in more than one-third of the samples. Next, gene expression values were log-transformed, then outlier genes and samples were removed in an iterative process, as described previously43,65,66. In brief, gene expression values more than three standard deviations (SD) from the mean for that gene across all samples were masked out, and samples with a mean inter-sample correlation more than two SD from the overall mean were removed. This process was repeated until no more expression values or samples exceeded these thresholds, and resulted in the removal of 33 samples and 775 genes, leaving 11,641 genes across 52 samples representing six colonies (D19: n = 8; D24: n = 10; D25: n = 10; D27: n = 9; D29: n = 8; D30: n = 7) for further analysis. Samples were quantile normalized, then the effects of the sequencing run on average gene expression were corrected using ComBat62, with colony as a biological covariate.
Network construction
WGCNA was performed as described, in the R WGCNA library43,65,66,67. Signed Pearson correlations were computed for all gene–gene pairs to generate a symmetric correlation matrix, which was transformed using a power function ((1+correlation)/2)β) to form the adjacency matrix of network connection strengths. β was determined empirically using the scale-free topology criterion (signed network: β = 1268). Next, a topological overlap (TO) matrix was computed based on the adjacency matrix and average linkage hierarchical clustering was performed using 1–TO as the distance metric69. Modules were defined using a dynamic tree cutting algorithm to prune the resulting dendrogram70, and labeled by arbitrary colors underneath the dendrogram. To study module composition, MEs were defined as the first principal component of each module, effectively summarizing the expression variability within modules. MEs were used to quantitatively relate gene coexpression patterns to phenotypic traits and construct ME correlation networks to study higher-order relationships among the modules. Eigengene-based connectivity (kME) was defined as a gene’s correlation with the ME, quantifying the extent to which its expression profile conformed to the largest source of variability within the module.
Enrichment for densely interconnected modules
An iterative filtering process was performed to enrich the final network with modules composed only of the most densely interconnected genes43,66,70. First, the soft threshold for constructing a signed weighted coexpression network was determined with the scale-free topology criterion applied to all genes. Then, a preliminary network was constructed using default module definition (dynamic tree cutting) settings, except for a minimum module size of n = 80 genes, to ensure suitable power for downstream module enrichment tests. The average TO within each module was defined as the module density, which was then compared with the density of 10,000 pseudo-modules of the same size that were generated by randomly selecting genes from the network. A p value for the density of each module was defined as the number of pseudo-module densities greater than the actual density, divided by 10,000. Genes in modules with p > 0.01 and gray background genes were removed. The network was rebuilt with the remaining genes, and the process was iterated until all modules passed the density test and there were no more gray genes, leaving 7085 genes in the final network. To confirm the efficacy of the additional filtering for ensuring module robustness, we computed module quality statistics using the WGCNA function modulePreservation70. Typical module preservation statistics were used to evaluate the preservation of modules in test networks created by randomly permuting the actual gene module assignments. These statistics were interpreted as indicators of module density and separability (distinctness of modules from others in the network), i.e., module quality. Averaged across many permutations of the original data, module quality statistics were indicative of module robustness and reproducibility. Summary scores of Z > 10 were interpreted as strong evidence of densely interconnected, distinct, reproducible modules, and modul Z scores ranged from 11.23 (green module) to 63.48 (pink module). Modules ranged in size from 108 to 2182 genes (median = 355 genes).
dN/dS estimation and analysis
dN/dS is a summary statistic that quantifies the degree to which each protein-coding genomic locus is constrained by purifying selection acting on its translated sequence. A low dN/dS value represents a strong history of purifying selection, or high sequence constraint, whereas a high dN/dS value can represent either relaxed selection or positive selection for a novel trait. The dN/dS values were calculated using the “orthologr” package71,72. Orthologs were computed between the predicted proteome of P. barbatus and six other species: the honey bee Apis mellifera73, plus five ant species: Harpegnathos saltator74, Ooceraea biroi75, Monomorium pharaonis45, Linepithema humile76, and Camponotus floridanus74. Homologs were identified with a reciprocal best BLAST hit approach at a cutoff E value of 1E-5. dN/dS was calculated with the method of Comeron77. For each species, every non-missing dN/dS value was then recoded as its decile value (e.g., lowest 10% of dN/dS values recode to 1, highest 10% of dN/dS values recode to 10). The decile transformation facilitates comparisons across species of various evolutionary distances71,72.
For analyses involving the relationships between gene expression, dN/dS, and WGCNA module centrality, a subset of 5186 loci with an estimated dN/dS was constructed from the list of 7085 loci included in any of the 11 modules. For analyses involving raw TPM expression level as a predictor, we performed all regressions on all 5186 loci, as well as the subset of 5138 genes that were in the lower 99% of expression percentiles and lower 99% of expression variability.
We used a generalized linear model to consider how coexpression centrality and correlation with colony traits were associated with evolutionary coding sequencing constraint (dN/dS) after accounting for the covariates of expression level (Median TPM), and expression variability (standard deviation among all n = 85 samples). Full results for the models are provided in Supplementary File 4).
Statistics and reproducibility
Statistical analysis was performed with the specific methods described in sections above. Nine colonies were chosen for RNA sequencing because these were the colonies with behavioral and physiological trait data. From each colony, we created RNA-seq libraries from 10 single-forager brains. The sequencing company (Novogene) completed library construction and sequencing for 85 of the 90 libraries. All biological samples were consumed in the RNA-seq library preparation process, and thus are no longer available. To ensure bioinformatic accuracy and reproducibility, all RNA-seq data were used for downstream analysis, except when samples or loci were pruned for specific tests and following standard protocols. RNA-seq data from each nestmate brains was considered as a biological replicate with respect to tests for colony variation in gene expression, and as an individual sample (with colony as sample metadata) for tests involving gene coexpression.
Reporting summary
Further information on research design is available in the Nature Research Reporting Summary linked to this article.
Source: Ecology - nature.com