Study sites
Entomological monitoring was conducted in 12 villages in Migori (−1.0667S; 34.4667E) and Homa Bay (−0.5396S; 34.4565E) counties from July 2016 to February 2018. Six IRS intervention sub-counties were in Migori County, and six control sub-counties were in neighbouring Homa Bay County (n = 4) and unsprayed areas of Migori County (n = 2) (Fig. 1). The residents in the study area are mainly of the Luo ethnic group and are subsistence farmers with a few growing cash crops such as sugar cane and tobacco. Residents mostly live in small houses, clustered into family social units called compounds. The region has bimodal peaks of rainfall with the long rains between April and June and short rains in October and November. The Lake Victoria region of western Kenya is malaria endemic; the most recent Malaria Indicator Survey in 2015 documented a malaria prevalence of 27% by microscopy. The last mass net campaign in the region was conducted in April 2017 with DawaPlus 2.0, a deltamethrin long-lasting (coated) insecticidal net distributed in this area. Though 87% of households own at least one LLIN and 60% own more than one LLIN, only 54% of households have an adequate number of nets, defined as one LLIN for every two residents. Among residents of western Kenya, 68.4% reported to have slept under any net the night before the survey while 66.9% had slept under LLINs14. Anopheles funestus, An. arabiensis and An. gambiae s.s. are the main malaria vectors in the region33,34. Insecticide resistance among major malaria vectors in Kenya has been reported for pyrethroids, carbamates, and organochlorines35. The reported resistance mechanisms include both target site mutations and increased activity of enzymes involved in metabolic detoxification21,22,23.
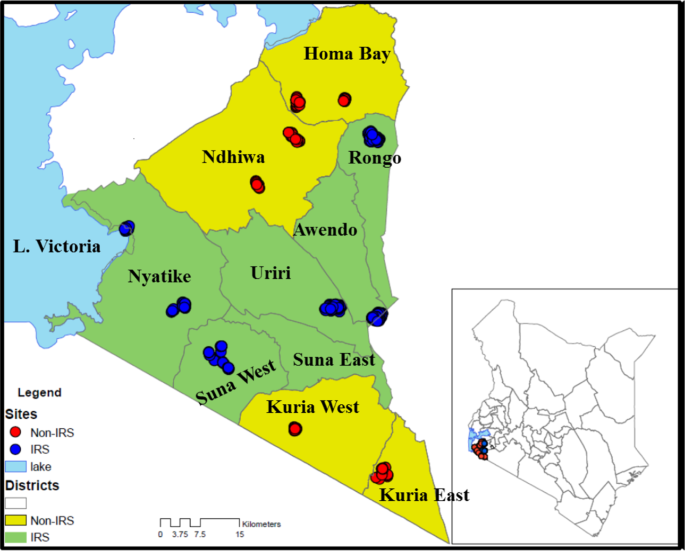
Map of Kenya, showing study sites in western Kenya with the names of sub-counties. Yellow shading represents non-intervention sites and red dots represent sampled houses. The green shading is the intervention site with the blue dots representing sampled houses (The map was created on ArcGIS 10.2.2).
IRS campaign
IRS was conducted in February-March 2017. A total of 212,029 houses in Migori County were sprayed, representing coverage of 97.7% of houses sprayed against houses found. The campaign covered a population of 906,388 people, including 16,932 pregnant women and 127,157 children below five years of age36.
Vector surveillance
Vector surveillance was conducted in the twelve villages from July 2016 to February 2018. Houses were randomly selected in each village every month for mosquito collections by PSC and indoor CDC light trap (CDC-LT). Household information including roof type, wall type, open or closed eaves, the presence of nets, number of people that slept under a net the previous night and those that did not, and the presence of cattle were collected on a tablet computer. The mosquito density for each method were expressed as the mean number of mosquitoes caught per house per collection visit.
Indoor-resting mosquitoes were collected between 07:00 and 11:00 by PSC in five houses per site per month. PSCs were done by laying white sheets on the floor and over the furniture within the house. Two collectors, one inside the house and another outside, sprayed around the eaves with 0.025% pyrethrum emulsifiable concentrate mixed with 0.1% piperonyl butoxide (supplied by the Kenya Pyrethrum Board) in kerosene. The collector inside the house then sprayed the roof space. The house was closed for 10–15 minutes after which knocked-down mosquitoes were collected from the sheets and transferred to the laboratory in scintillation vials containing 70% ethanol.
Indoor host-seeking mosquitoes were collected by CDC-LT in 10 houses per site once per month. A single 12-volt CDC-LT was hung in each house in the sleeping area, approximately 1.5 meters from the floor, adjacent to an occupied bed net owned by a member of the household. The traps were run from 18:00 to 07:00 the following morning. The trapped mosquitoes were transferred into paper cups and transported to the laboratory for further analysis.
Human landing catches (HLC) were used to assess biting time and location (indoor vs outdoor) of the local vector population before and after spraying. HLC was done during the short rains pre-IRS in November 2016, and after the long rains in June 2017. Collections were performed at six sites used for routine surveillance, two in non-IRS areas and four IRS areas. In each site, five houses were randomly selected, and collections were performed for five consecutive nights in each house once before and after IRS.
During HLC, one volunteer sat outside within 5 meters from the house, and another sat inside the house in the living room. Collectors kept their trousers folded to knee length and aspirated any mosquitoes landing on their lower legs. Each house had a team of six collectors, each working in pairs during one of three six-hour shifts running from 17:00 to 11:00 the next morning. Collections were performed for 45 minutes, and the collectors rested for 15 minutes in each collection hour. The collectors recorded the location of members of the household observed at the end of each hour as either outdoor, in the living room, or in the bedroom. Collected mosquitoes were separated by time and location of collection and sustained on 10% sugar solution before being transported to the laboratory for analysis. Estimation of exposure of individuals to bites by An. funestus was performed using models previously described by Seyoum et al.37.
Persistence of insecticidal activity on sprayed walls
To assess the persistence of insecticidal activity on sprayed walls following IRS, WHO cone bioassays38 were conducted each month using laboratory-reared, 2–5 day old, non-blood fed susceptible colony of An. gambiae s.s. Kisumu strain. Mosquitoes were exposed in 10 randomly selected sprayed houses, seven with mud walls and three with cement walls, in each of four sub-counties in Migori county. Exposures were performed with ten mosquitoes per cone each month in the same houses at three different heights (0.5 m, 1 m, and 1.5 m) from the floor for 30 minutes, on three different walls of the living room of each sprayed house. A control cone with ten mosquitoes was set on an unsprayed plywood board outside of each sprayed house in a shaded area close to the house. Temperature and relative humidity were recorded at every house where mosquitoes were exposed.
Insecticide resistance monitoring
WHO insecticide susceptibility tests were performed in Rongo, Nyatike, Awendo and Uriri sub-counties in Migori County (IRS sites) and Homa Bay and Ndhiwa sub-counties in Homa Bay County (no IRS). Larval stages of An. gambiae s.l. were collected from Homa Bay, Ndhiwa, Rongo, Nyatike and Awendo sub-counties before IRS and in Homa Bay, Ndhiwa and Rongo after IRS. Larval samples were collected mainly from borrow pits, tire tracks, farmlands and trenches. The collected larvae were raised to three-day-old adults before testing. Adult An. funestus were also collected by hand aspiration inside houses for insecticide resistance tests, as larvae were difficult to find. Collections were performed in Homa Bay and Ndhiwa, Rongo, Awendo and Uriri sub-counties before IRS. However, after IRS few adult mosquitoes were in the sprayed sites, so no An. funestus s.l. were available for testing from these areas. CDC bottle intensity assay was used to assess intensity of resistance for An. arabiensis from Awendo, Ndhiwa and Homa Bay counties. Three-day-old adults raised from field-collected larvae were exposed in bottle coated with doses of 1X, 2X, 5X and 10X of permethrin. Survival frequency of An. arabiensis to the different doses was determined at 30 minutes exposure period.
Insecticide resistance status was assessed using the WHO diagnostic concentrations of deltamethrin (0.05%), permethrin (0.75%), pirimiphos-methyl (0.25%) and alpha-cypermethrin (0.05%). All papers were prepared by the WHO collaborating centre, Universiti Sains Malaysia. The WHO bioassay was done using 2- to 5-day-old An. gambiae s.l. emerging from collected larvae or by direct exposure of field-collected adult An. funestus since these were difficult to collect as larvae. At least 100 mosquitoes (four replicates of 25) of each species were exposed to each insecticide per sub-county. The samples were then transferred to a holding tube, provided with cotton wool soaked in 10% sugar solution and held for 24 hours. Mortality was scored 24 hours after exposure.
Mosquito species identification, sporozoite infection and blood meal identification
All Anopheles collected were identified morphologically to species using the keys of Gillies and DeMeillon or Gillies and Coetzee39,40. The physiological status was determined by observation of the abdomen to classify female mosquitoes as either blood-fed, gravid, half gravid or unfed. Female mosquitoes were dissected into three parts for various procedures: heads and thoraces were used for determination of Plasmodium falciparum sporozoite infection by enzyme-linked immunosorbent assay (ELISA) using the MR4 Methods in Anopheles Research adapted from Wirtz et al.41,42; the abdomens of blood-fed females were used to determine the source of mosquito blood meals by targeting cytochrome b protein using a multiplexed PCR protocol43, with slight modifications. The legs and wings were used in PCR analyses to identify to species level members of the An. gambiae species complex and Anopheles funestus group44. All mosquitoes morphologically identified as An. gambiae s.l. and 20% of randomly selected An. funestus s.l., were analyzed by PCR each month. This approach was done due to the greater number of An. funestus collected and based on previous studies in the area showing that An. gambiae and An. arabiensis are found in sympatry, while An. funestus s.s. was the only member of the species group routinely collected33,34.
Health facility surveillance
Health facility laboratory data were collected from Rongo, Uriri, and Macalder sub-county hospitals within Migori County (IRS) and Marindi health centre and Ndhiwa sub-County hospital in Homa Bay County (No IRS). The facilities were chosen based on proximity to entomological surveillance sites, availability of health records and catchment area as falling within either IRS or non-IRS area. Febrile cases were tested by health facility staff using light microscopy as part of routine health care and data were recorded in registers provided by the Kenya Ministry of Health. Data were abstracted from laboratory registers of the selected health facilities for the period from January 2015 until June 2018. Each page of the register was photographed using a smartphone camera, and the photographs converted to PDF files using CamScanner-Phone PDF creator, (INTSIG Information Co., Ltd). To ensure confidentiality, the column containing the patient’s name was covered when taking the photograph. The PDF copies were then printed and filed.
Data management and analysis
Field entomological data collection used Open Data Kit software (ODK) run on tablets with an interface designed to limit data entry errors. Data entry screens used drop-down menus and automatic data checks to reduce errors. Each house sampled received a unique code and a study number. Individual mosquitoes were placed in Eppendorf tubes labeled with pre-printed barcodes and linked to the field data by house code and a unique study number. Results of additional testing, including sporozoite ELISA, species identification by PCR and blood meal analysis, were linked to an individual mosquito by the unique barcode label. Individual patient records included date of testing, age, gender, village, clinical diagnosis, test performed, and test results from scanned copies of health facility registers. Data were entered into a Microsoft Access database.
Data analysis was performed using R statistical software version 3.4.1 or SAS version 9.4. The risk ratio (RR) was used to assess the statistical significance of differences in mosquito densities pre and post IRS, between intervention and non-intervention sites. Data were fitted using Generalized Linear Mixed Effects Statistical Models (GLMMs). Since the data were over-dispersed, we used the package Generalized Linear Mixed Models using Template Model Builder (glmmTMB) or PROC GLIMMIX, to fit negative binomial distribution models for the analysis of mosquito numbers. The numbers of female Anopheles mosquitoes were assessed as a function of the period of collection (before or after IRS) and intervention status (sprayed or non-sprayed) as a fixed effect, while village was treated as a random effect. To obtain the risk ratios (RR) and confidence intervals, we exponentiated the model coefficients. Models were adjusted for reported net use, the presence of open eaves, and the presence of cattle on the compound. A test of interaction was performed to compare differences in estimates of mosquito numbers between the period of mosquito collection and intervention status45. Conditional estimates of the change in mosquito densities pre- and post-IRS conditional on the IRS or non-IRS County were generated. To analyse Anopheles species proportions pre-and post-IRS in intervention and non-intervention areas for each trapping method, a binomial GLM model was used. The model was also used to analyse sporozoite rates (proportion of sporozoite ELISA tests that are positive) and human biting rates between intervention and non-intervention sites, before and after IRS and proportions of the types of mosquito host blood meals.
To detect changes in numbers of malaria cases before and after IRS within each health facility Auto-Regressive Integrated Moving Average (ARIMA) analysis was performed. Data from each facility was analysed using the “Time Series Analysis” (TSA)46 and “Alternative Time Series Analyses” (aTSA)47,48 packages in R. The ARIMA model was derived by observation of the autocorrelation and partial-autocorrelation functions to determine the most parsimonious solution of the “order” (p), “differencing” (d), and “moving-average” (q) parameter values. The model was then regressed on the absence (prior to) or presence of IRS in the village to estimate the value of the number of positive malaria cases prior to, and during the period of IRS.
Ethical considerations
The study was approved by the Kenya Medical Research Institute/ Scientific and Ethics Review Unit (KEMRI/SERU), number 2776 and by CDC through a reliance agreement with KEMRI/SERU (CDC IRB 6728). Individuals participating in HLC gave informed consent. They were screened for malaria before the start of the study and treated if positive. Collectors were placed on mefloquine malaria prophylaxis, (Mephaquin, Acino Pharma AG, Switzerland) one week before collections began, with repeat doses once every week through the collection period, until four weeks after collections ended. During routine mosquito collections, verbal consent was sought from the household head to use CDC-LT and PSC in their compound. All methods were performed in accordance with relevant guidelines and regulations.
Source: Ecology - nature.com