Conservation, restoration, and rewilding of complex systems are global grand challenges. Important conceptual developments in these fields include habitat occupancy models1, species distribution models2, and home-range analyses with occurrence data3. We need to know how plants and animals use and occupy space. Nonetheless, many animal populations including endangered species likely have limited access to potential resources and habitats. The old adage ‘location, location, and location’ certainly applies to all species under threat because the capacity to choose to use habitat can be constrained by availability and relative location. This is a profoundly importantly perspective for strategic restoration and protection because extinction risks are predicted to rise to 30–50% globally4. Strategic restoration can be framed as evidence-based decision making. It is informed by science that directly shapes planning where to protect lands and identifies attributes on these lands that can function as critical tipping points. Here, we use a resource selection function analysis for a key indicator desert species regionally5 to provide an estimate of the relative probability of habitat selection within its home range6. This tool on its own does not necessarily assess the value of specific habitat features within a landscape, but it does provide a crucial stepping stone in understanding areas with greater intensities of selection by sampled individuals relative to availability7. We show that shrub cover is a crucial habitat type used by an endangered species of lizard in Carrizo Plain National Monument, California. Environmental predictors of relative use including elevation, slope, and solar radiation were also important and effectively described the environment with a normalized vegetation difference index. Data at many scales are important, and here we found that downscaled estimates from imagery of relevant ecological attributes of the location consistently predicted the fine-scale association with simple features for this species from field telemetry relocations. These scoping data must however be coupled with fine-scale sampling and meaningful ecological insights of interactions8,9. This large protected area thus likely provides critical resources for an endangered species satisfying some of its associated conservation priorities10,11.
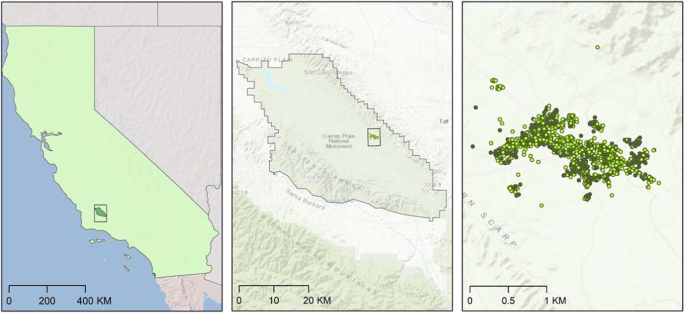
Telemetry and the tracking of animal movement is a rapidly evolving field of research for ecology, wildlife management, and conservation globally. However, the incredible leaps in the capacity to map and quite literally test new ideas ‘at scale’ are also associated with some limitations12,13. Matching the scale of these data to other spatial assets and applying meaningful ecological inferences to the species at hand are non-trivial decisions. Typically, relatively large-scale animal data regionally or on landscapes are modeled using ecological niche approaches and habitat occupancy models whilst finer grain animal tracking datasets are interpreted using resource selection functions12,13. Resource selection functions contrast ‘used’ and ‘available’ locations within a region by a set of individuals for a species. Subsequently, this tool explores the relevant landscape attribute classifications of each set to build predictions of the realized patterns of selection for the individuals examined in a study for their habitat at fine scales. Herein, we examined the latter approach for an endangered species of lizard Gambelia sila (G. sila) because it was in the first group of species listed as endangered by the USA in 196714 and because it is also an excellent indicator of ecosystem health regionally in these drylands5. The primary goal was to examine the relative probability of selection for different resources types within a specific landscape7. Reptiles are particularly sensitive to global change including habitat loss, drought, and temperature increases5. Importantly, previous evidence showed that it is commonly associated with shrubs within this dryland ecosystem15,16 thereby informing a potential key biotic driver for resource selection models. Individuals of G. sila were sampled within Carrizo Plain National Monument to an extent of 1.92 km2 (Fig. 1 shows all field relocation instances, and net area occupied was conservatively derived from 95% minimum convex polygon home-range estimates, see Methods). This distribution is similar to previous wildlife studies published for G. sila17,18. This endangered species was most frequently relocated belowground, i.e. in burrows (GLM, Chi-square mesohabitat = 4.61, p = 0.0001), and relocation frequencies increased with higher shrub densities estimated in the field (GLM, Chi-square shrub density = 0.85, p = 0.0001). These data also included an estimate of the associated vegetation in each instance. The relevance of shrub cover and other features was tested as predictors in the resource selection function models. Resource selection functions fit to telemetry data tell us about the act of habitat selection not presence or use7. Telemetry follows a subset of individuals in a population, and the data represent the sequence of decisions made by these individuals. Collectively, this is a representation of behavior by habitat-type associations within a target landscape.

A set of maps showing three different scales of potential animal occurrence data and subsequent models for an endangered animal species case study in California. From left-to-right, the first panel shows California within an inset denoting the regional sampling focus specific to this study. Data can be sampled throughout the entire range of a species depending on its distribution and extent and are typically modeled with Maxent. The middle inset maps the estimated home ranges using 95% minimum convex polygon models for the lizard species Gambelia sila within Carrizo National Monument, California, USA from 2016 to 2018. The inset on right shows the fine-grain telemetry relocation data collected as points. A total of 3553 instances were sampled for a total of 80 unique individual animals. Shrub and open designations describe whether the individual animal in each was instance was within 5 m of a shrub (dark green points) or in the relative open not near the canopy of a shrub (light green points). In this study, we use resource selection functions to infer predicted likelihoods of habitat use patterns at this scale. Base map credits ESRI.
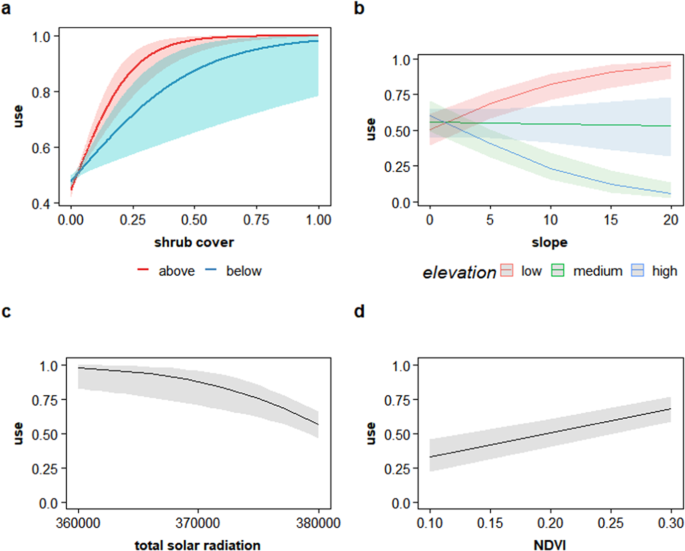
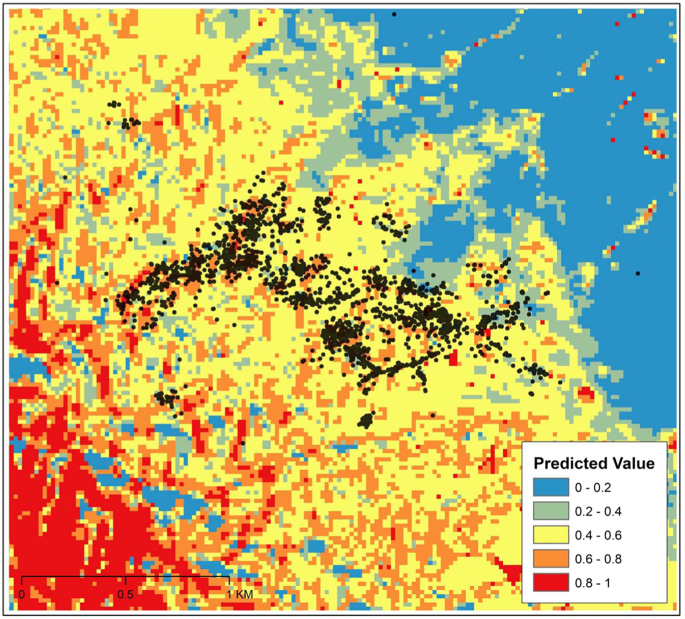
Passive rewilding and many other restoration and analytic approaches assume dispersal, reintroductions/translocations, and availability of space are viable options. We adopt a parsimonious approach with resource selection by analyzing the importance of location relevant to a species at the scale that the animal experiences. This method ensures that we understand the patterns of selection for an indicator animal species and the preferential selection of the locations that they can realistically access. This does not provide inference to habitat value or fitness of individuals but does highlight locations with higher intensities of use hopefully for the better and not the worse because of potential ecological traps or spatial bottlenecks19. It has been proposed that rewilding and managing complex ecosystems must always examine the environmental infrastructure to restore an ecosystem20. Downscaled data from imagery for a specific study region is a mechanism to estimate these drivers. These measures can provide the potential boundaries and constraints of “location, location, and location” in addition to estimates of the relative importance of competing selection for different environmental resources20. We derived shrub cover, elevation, slope, solar radiation, aspect, and normalized difference vegetation index (NDVI) attributes for the landscape as simplified indirect measures for the trophic complexity (i.e. shrub cover), dispersal limitations (slope and elevation), and some stochastic processes (solar radiation) that the system experiences. We then trained models and tested the predictive capacities of these classifications for likelihood probabilities of G. sila presence at a protected dryland area in California, USA. These analyses were at finer grain sizes relative to previous models for this species regionally5. Increasing shrub cover positively predicted lizard presence (Fig. 2a, GLM, Chi-square shrub cover = 41.4, p = 0.0001, Supplement A) in the resource selection function model similar to the telemetry relocation field data (described above). The effects were robust and typically consistent from year-to-year (Supplement A). Critically, for each fine-scale telemetry relocation instance, we also in situ coded whether the individual animal was physically associated with a dominant shrub through direct observation and used this ecological information to validate the downscaled estimates of shrub cover in subsequent models. This contrast provides a robust ground-truthing mechanism. The data aggregation approach and GIS classifications were highly representative of field sampling (GLM model cross validation, 100 model iterations, Chi-square shrub contrasts = 38.57, p = 0.0001) suggesting that larger-scale data can augment finer-scale selection estimates13 (Supplement B). Shrub cover was more strongly selected when lizards were observed above ground similar to previous ecological research16. Decreasing slopes and elevations positively predicted animal presence, but at the lowest elevation class tested, increases in slope (at that elevation class) can increase the likelihood of habitat selection (Fig. 2b, GLM, Chi-square slope = 188.12, p = 0.0001 & Chi-square elevation = 44.31, p = 0.0001). This suggests that dispersal limitations within a region are a valid consideration for an endangered species21. Estimated solar radiation and aspect were significant drivers of predicted habitats confirming that stochastic processes are also relevant (Fig. 2c, GLM, Chi-square solar = 3.87, p = 0.049, GLM, Chi-square aspect = 138.03, p = 0.0001, Supplement C). Finally, NDVI was an important ecological predictor of habitat selection with increases in estimated total cover of all vegetation associated with higher intensities of relative selection for this endangered species (Fig. 2d, GLM, Chi-square NDVI = 50.31, p = 0.0001). The effect of increases in this estimate of relative habitat intensity selection suggest that, at least at the cover levels within this ecosystem for this set of individuals, vegetation does not interfere with animal movement and either increases non-trophic complexity by providing shade or refuge from predators or indirectly enhances complexity through increased access to prey items such as invertebrates living in or under plants16. An overlay of telemetry sampling on the predicted resource function probability grid cells using shrub cover, slope, aspect, elevation, and NDVI (Fig. 3) suggests that vegetation including shrubs can be an important component of predicting desert vertebrate animal selection patterns in drylands. These finding support previous research showing that ecological foundation species such as shrubs in drylands consistently facilitate other species22,23.

A set of resource selection function models examining the predicted probabilities of the lizard Gambelia sila resource use by relevant biotic and abiotic landscape attributes. Probability of use was derived from contrasts of resource selection function models for ‘used’ and ‘available’ telemetry relocation instances from a resource selection function (see Methods for full details). (a) Resource selection function for total probability of shrub cover estimated from imagery on the predicted probability of animal relative use. Above and below described above or belowground predicted relative use from sampled telemetry relocation field data. (b) The relative importance of percent slope and three elevation binned categories on the predicted relative use. Low described predicted occurrences at a mean elevation of 670 m, medium at 715 m, and high at 745 m. (c) Solar radiation in W/m2 on the resource selection function probabilities for relative use by this species. (d) The predicted importance of probability of normalized difference vegetation index (NDVI) on animal probability of relative use.

An overlay of telemetry field sampling relocation points for the lizard Gambelia sila on its predicted resource selection function likelihood probabilities using shrub cover, slope, aspect, elevation, and NDVI to model landscape attributes. Telemetry data were collected from 2016 to 2018 at Carrizo National Monument, USA. Blue pixels and cooler colors denote low probabilities and red denotes relatively higher estimates from the resource selection function predictive model using all factors described above.
Protected areas can be large-scale sandboxes for restoration architects to experiment, document, and build critical conservation plans similar to this project. Initially, these landscapes were established to protect iconic places or species such as G. sila but are facing increasing demands to deliver local, long-term biodiversity functions10. There is a call to both upsize and interconnect these critical areas but to do so adaptably depending on context and constraints11. Hence, we need comprehensive data on ‘bright spots’ such as Carrizo Plain National Monument and other public lands worldwide that are both iconic and functional that support and highlight a diversity of habitats24. Blending occurrence and species presence data with models aligns with this goal but needs to be ground-truthed through sampling such as telemetry and other animal tracking tools25,26. Planners must now include function for many species as a key criterion to avoid continuing declines and mismatches between protected areas and the needs that locations provide for species10,11. Extinct is too late, and rare and endangered species within these protected sandboxes can be indicators of change27. Extinction triggers can be direct or indirect, and it has been proposed that some of the drivers that precipitate species rarity by changing the structure and function of supporting ecology can also lead to future extinctions27. Interactions and functions can thus both lead to cascading effects on ecosystem structure28. The resource selection function is a proxy for habitat selection29, and neither this specific tool nor protected areas are new ideas10,30. Selectivity is a product of preference by the animals and habitat, and we need to examine these interactions quantitatively and iteratively (i.e., https://cjlortie.shinyapps.io/Resource_selection_function_app/). Resource selection behavior is also highly context dependent with behavior changing as the availability of different habitat types changes (i.e., a functional response)6. Critical attributes with associated likelihood estimates of contemporary selection are nonetheless critical conservation data for many animal species, and the potential interaction between preference and availability for locations is cogent to conservation and biodiversity.
Source: Ecology - nature.com


