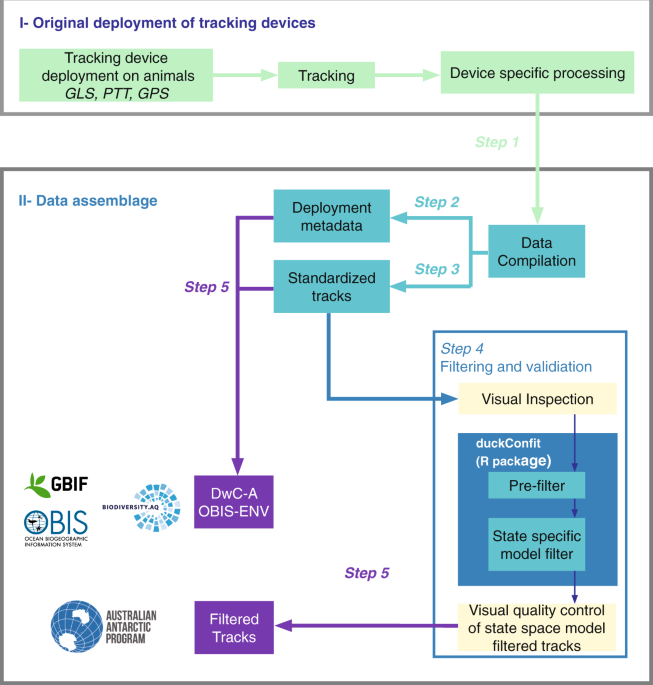
Original deployment of tracking devices
RAATD aggregated data from three types of tracking devices (Fig. 1). In increasing order of precision these are light-level recording Global Location Sensors (GLS loggers or geolocators), satellite-relayed Platform Terminal Transmitters (PTTs), and Global Positioning System devices (GPS). Typically, GLS and GPS devices record data in internal memory, and must be physically recovered in order to download the data. PTTs transmit a carrier signal to satellites, and can deliver data remotely and in near-real time. Some modern devices now combine the capabilities of PTT and GPS (or other) devices, relaying high-quality GPS data to the end user via satellites. GLS devices, which are among the smallest, allowing for deployments on smaller predators, typically record ambient light levels throughout the day, from which coarse estimates of latitude and longitude can be calculated (to within 100–200 km) using day length and timing of local noon. Some GLS units can also record sea surface temperature, which can help refine position estimates25. GLS locations were estimated by RAATD data contributors using five methods26,27,28,29,30 (GLS Methods23) and generally corresponded to individual distribution during the non-breeding season. GPS tags make use of global navigation satellite systems and provide very high resolution (about ten meters) location fixes and time information. Some are satellite-linked, while others have smaller batteries and must be recovered (i.e. the animal carrying the tag must be recaptured) to download the archived data. PTT tags transmit signals to ARGOS satellites which transfer the received signals to a receiving station at the Collecte de Localisation Satellites (CLS) in Toulouse, France, to estimate locations based on Doppler shifts in the received signals to an accuracy of approximately 1,000 m. Processing by CLS involved a least-squares filtering method up to 2008, thereafter Kalman filters have been used31. Different models of GLS, PTT, and GPS devices from different manufactures have been used throughout the years, each having specific characteristics (size, operating modes, etc.) that may influence accuracy of the locations, but because device type was not always provided by the data providers, a standard correction has been applied in RAATD (see below). In summary, the “RAATD core group” (i.e. the analysing team) worked on location data converted from light-level data by the data contributors, on CLS-processed PTT location data, and on raw data directly delivered by GPS devices.
Device attachment to animals was also species-specific. When loggers are small enough, like GLS, they are mounted on leg or flipper bands/tags, while larger data-loggers and transmitters are often attached to the plumage or pelage on the back or head of the animal, a position that optimizes data communication with satellites. Modes of attachment on the back varied from using harnesses, glue or marine tape. For whales, transmitters with subcutaneous anchors were attached to the back, using poles, cross bows or air guns. Scientists limited handling time and stress as much as possible during attachment and retrieval of devices, e.g.32,33,34,35,36,37, following established animal handling guidelines that meet ethical reviews. However, it should be noted that the RAATD dataset contains tracking data that span almost three decades, during which time substantial progress has been made in terms of miniaturization and advances in electronic components. Any adverse effects of devices on animals are therefore likely to be less acute in recent years compared to the earlier years of tracking.
Data assemblage
Step 1. data collection
Starting from 2010, RAATD compiled a catalogue of existing (both published and unpublished) tracking data by contacting international experts that held data. Data were also harvested from existing repositories, including the Australian Antarctic Data Center (https://data.aad.gov.au/), the Integrated Marine Observing System (http://imos.org.au/), PANGAEA (https://www.pangaea.de/), BirdLife International (http://www.seabirdtracking.org/), the Antarctic Biodiversity Portal (http://www.biodiversity.aq/), Ocean Biogeographic Information System (http://www.iobis.org/), and the Global Biodiversity Information Facility (http://www.gbif.org/). The data-collection phase ended in 2016.
Step 2. associated metadata
Where available, information on the deployment site and relevant characteristics of the animal at the time of deployment was standardized. Where age class and sex were known, this information was included in the metadata.
Step 3. data standardization
Location dates and times were converted to UTC (Coordinated Universal Time). Records with missing latitude or longitude values were removed, and all longitudes were transformed to lie between 180 °W and 180 °E. Data files were row-ordered by individual, with rows within an individual in their correct temporal sequence. Near-duplicate positions, defined as animal positions that occurred three seconds or less after an existing position fix from the same animal, and which had identical longitude and latitude values (for GPS devices) or longitude and latitude values that differed by less than 1−05 and which had the same location quality value (for PTT devices), were removed.
Entries in the age class, breeding stage, device type, location quality, scientific, common, and abbreviated name, sex, and deployment site columns were validated against controlled vocabularies. Mandatory entries (e.g., deployment date, device type, individual animal identifier) were checked for missing values. When the data contributors could not provide missing deployment dates, the first data point of the track was used as a reference point for deployment. Where animal identifiers were missing, they were created from the the tag identifier or file name.
Deployment locations were recorded by the original field team either at the individual-animal level (using e.g., a hand-held GPS device) or at the deployment-site level (i.e., one deployment location per group of animals). The latter was common for deployments at colonies, whereas the former was most common for non-colony deployments (e.g., seals and whales). Where deployment locations were not recorded by the field team, the first location estimate(s) in the tracking data were used. Deployment site names were standardized to colony names wherever possible (e.g., to the beach-on-island level).
Periods at the start or end of deployments were identified and discarded if there was evidence that location data during these periods did not represent the animals’ at-sea movement. For example, tags may have been turned on early (thereby recording locations prior to their deployment on animals) or animals may have remained at the deployment site, e.g. the breeding colony, for an extended period at the start or end of the tag deployment. Some tracks also showed a marked deterioration in the frequency and quality (for PTTs) of location estimates near the end of a track. Such locations were visually identified based on maps of each track in conjunction with plots of location distance from deployment site against time. This information is captured in the location_to_keep column appended to each species’ raw data file (1 = keep, 0 = discard).
Step 4. data filtering
Each track in the standardized dataset was visually inspected by the Data Editorial Group, and flagged for removal (using the keepornot column in the metadata file) if location estimates appeared unreasonably noisy relative to the length and extent of the track, and/or the location estimates were very irregular in time.
Next, automated quality-control checks were used to remove individual deployments that: (1) were flagged for removal (keepornot column in the metadata file); (2) had fewer than twenty location records; or (3) had deployments lasting less than 1 day. Additionally, individual deployments were checked to ensure that: (1) near-duplicate records in PTTs (locations occurring within 2 min of each other) were removed; (2) PTT Argos Z-class locations were reclassified as B-class locations (the least precise Argos location quality class that has an associated error variance38); and (3) locations implying unrealistic travel rates during the preceding time step (over 10 m s−1 for penguins and marine mammals and over 30 m s−1 for flying seabirds) were removed. Note that the definition of “duplicate locations” in the filtering context is more aggressive (less than two minutes vs less than three seconds) than that used during data standardization: for standardization, the intention was to keep the data as close to original as possible, whereas for filtering the presence of multiple positions in a short period of time (less than two minutes) has a negative effect on the filter performance.
A state-space model (SSM) was used to estimate locations at regular time intervals (one hour for GPS data; two hours for Argos data; twelve hours for GLS data) and account for measurement error in the original observations12,38. The data were SSM-filtered and subjected to a final quality control where tracks that failed to converge, as judged by nlminb convergence criteria39, were re-fitted using different initial values. If re-fitted tracks continued to fail to converge they were removed from the final filtered dataset.
For converged tracks, longitude and latitude residuals were examined for systematic trends indicative of lack of fit. Tracks that failed this inspection were removed from the final filtered dataset.
Step 5. data publication
RAATD established a data-sharing and publication agreement with all data providers in 2017. The standardized (trimmed) and filtered data are held in a data repository hosted at the Australian Antarctic Division (AADC) (see details below, in the ‘Standardized Data’ section). The filtered data are also according to the OBIS-ENV guidelines40 published in international repositories through the SCAR Antarctic Biodiversity Portal (see details below, in the ‘OBIS-ENV compliant data’ section). For this purpose, and to ensure standardized file structure, secure (meta)data storage and the facilitation of community access to the data (where appropriate), the resulting datasets have been uploaded to the biodiversity.aq IPT instance (Integrated Publishing Toolkit; www.ipt.biodiversity.aq), the accepted route for publishing data to the SCAR Antarctic Biodiversity Portal (www.biodiversity.aq). This should ensure a seamless flow to the Ocean Biogeographic Information System (OBIS) and the Global Biodiversity Information Facility (GBIF).
Source: Ecology - nature.com

