Study system for case study
The PPR of Canada and the northcentral U.S. comprises the formerly glaciated and wetland-rich region serving as the primary breeding area for many North American waterfowl83,84,85 (Fig. 4). Historically, extensive grasslands along with abundant and diverse wetlands provided ideal habitat for successful waterfowl reproduction in this region86. Since human settlement, however, a majority of the PPR has become an important agricultural production area for cereal grain, oil seed and row crops. This region is one of the most productive agricultural landscapes in the world87 with a high potential for expansion of cropland and agricultural intensification4. Conversion of grassland to annual cropland and drainage and degradation of wetlands have significantly altered the landscapes in which waterfowl settle to breed88,89. These habitat losses represent the primary conservation concern for NAWMP90,91.
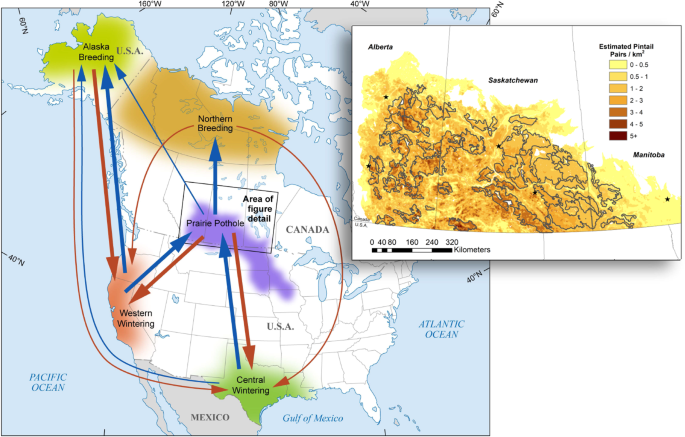
Fall (downward arrows) and spring (upward arrows) migration of the northern pintail between core breeding and wintering areas of North America. Arrow width scales with increasing proportion of pintails using each migratory pathway. The varying density of shading is a schematic to represent reduced pintail density along the periphery of each core region. Inset map shows long-term (1961–2009) average density of pintail pairs (pairs/km2) among conservation-planning target landscapes represented by gray outlines within the Canadian Prairies. Graphics are adapted from existing figures in the literature43,49,51.
Conversion of grasslands to cropland and associated alteration of predator communities in the PPR are thought to be the leading cause of long-term declines in waterfowl production in this region88,92,93,94. In addition, the intensity of cropping practices on existing cultivated lands has increased in recent decades. The largest and most economically and environmentally significant change in agricultural land use since the 1970s has been the decline in summer fallow. Through this practice, cropland was removed from production during alternate growing seasons for moisture accumulation, nitrogen release, and weed control47. In the Canadian Prairies, summer fallowing declined by approximately 90 K km2 from 1971 to 201695. In its place, the prevailing approach is continuous cropping with minimum and zero-tillage practices (hereafter, ‘conservation tillage’) requiring high nutrient and pesticide inputs47,48. While beneficial for soil conservation, reduced stubble disturbance in combination with spring seeding operations may create ecological traps for breeding birds96.
Migratory waterfowl are one of the most intensively managed groups of vertebrates in North America. Ongoing restoration and protection of habitats throughout the annual cycle along with annual regulation of harvest rates comprise modern waterfowl management60. Every year, millions of dollars are invested in conservation efforts within the PPR51,97,98. Improving the effectiveness of waterfowl management depends on a better understanding of how changes in habitat as a result of conservation activity will affect achievement of continental-level goals for species abundance19,58,99.
Conservation programs for breeding waterfowl in the PPR are generally targeted toward habitat for dabbling ducks in general, not to any particular species100. Primary conservation activities in this region include conversion of cropland to forage grass (hay or pasture) and idle grass, protection of existing grassland and wetlands, restoration of drained wetlands, and converting spring-seeded cropland to fall-seeded varieties51. These habitat manipulations serve multiple objectives; they not only maintain or restore the carrying capacity of the landscape to attract and hold breeding ducks, but they also increase breeding success through improved nest survival88,101,102. These conservation investments are expected to provide benefits for migratory ducks over the long term, assuming recurring use of these habitats by target species100,103.
Focal species
The pintail is of particular interest in its response to conservation actions. A significant population decline in the 1970s and 1980s caused concerns for hunters and bird enthusiasts, leading to its classification as a species of conservation concern104. Although the initial decline has been attributed to widespread prairie drought in the 1980’s, the leading hypothesis for lack of population recovery is agricultural intensification leading to reduced reproduction in the PPR19. Wetland loss, especially loss of small and shallow basins preferred by pintails, may have reduced the carrying capacity of the region to attract and hold pintail pairs105,106. Further, and likely more influential, have been changes in land use that have reduced the ability of pintails to successfully hatch nests107,108,109. Since 1990, the number of pintails at the start of breeding in North America has remained between 1.8 M and 3.6 M except for 2011 when the population was estimated at 4.5 M110.
Based on a population model for the PPR, declining productivity has been a main driver of changes in pintail abundance over the past five decades50. This study also found that productivity was negatively correlated with agricultural intensification at the subregional scale. Indeed a growing body of evidence from North America suggests that the decline in abundance of the pintail, a species that readily nests in residual crop stubble prior to seeding, may be linked to the increase in conservation tillage practices that reduce the availability of undisturbed stubble provided by fallowed cropland49,50,108. The economic value of birding and hunting associated with pintails in North America is estimated at >$100 M (2014 USD) annually10. A declining population is therefore not only a concern for biodiversity but also for society.
Unlike other dabbling ducks, pintails use croplands for nesting and begin nesting before crops are planted102,104,111,112. They therefore uniquely benefit from the high nest survival afforded by rotating crops between spring-seeded and fall-seeded crops such as winter wheat102,111. Pintails tend to settle opportunistically within the PPR in association with variably available wetlands, especially temporary and seasonal wetlands113,114,115. Predicting the impact of habitat conservation on the pintail population therefore requires an accounting of their distribution and habitat associations along with resultant changes in breeding success in affected landscapes. Such effects of amount and spatial targeting of conservation investments have until now not been investigated.
Modeling frameworks have been developed for predicting outcomes of habitat management for pintails at landscape to regional scales49 and regional to continental scales19. In addition, methods are emerging for explicitly quantifying the sources and patterns of funding for conservation of wildlife habitat in North America57. These developments render a great opportunity for linking modeling frameworks to predict the outcomes of funding scenarios for population dynamics of this migratory species.
Our study builds from previous work19 that used a FAC-PP model to investigate shifts in continental-scale population size and maximum sustainable yield caused by simulated changes in habitat quality within the PPR and within the Gulf Coast wintering region. The present study focuses on effects of landscape-scale habitat conservation within the PPR, as the previous study showed that increased age ratio in the PPR was more important than reducing the strength of density dependence for post-harvest survival in the Gulf Coast. The FAC modeling approach is needed to simultaneously account for effects of habitat conservation in the breeding grounds during summer and harvest across regions in the fall.
Overview of modeling approach
Before giving a detailed description, we provide an overview of the modeling framework for linking landscape-scale conservation of habitat to continental dynamics of the pintail population. Our general approach was to relate landscape-level alterations to expected changes in the breeding population at equilibrium while accounting for parameter uncertainty. As such, we altered the observed landscape according to alternative conservation scenarios. More specifically, we updated a land-cover map to characterize the current composition of the landscape as it pertains to waterfowl in the PPR. We then used existing models for estimating pintail distribution, hen success, and ultimately age ratio throughout the PPR. Here, we accounted for uncertainty in multiple reproductive parameters. Next, we developed alternative scenarios for conservation of pintail habitat in the PPR along with an uncertain harvest rate of pintails at the continental scale. As a final step we adapted an existing approach for modeling population dynamics at the continental level as a function of varying age ratios, mediated by landscape-scale conservation, while accounting for harvest during fall across all core regions of North America. We ran the model three times for each scenario based on the mean and 95% confidence limits of parameters for which we could quantify uncertainty based on empirical data.
Land-cover map and landscape-level habitat composition
We used Agriculture and Agri-Food Canada’s (AAFC) 2016 annual, 30-m crop raster (http://open.canada.ca/data/en/dataset/ba2645d5-4458-414d-b196-6303ac06c1c9) to estimate landscape composition in 2016 for eight habitat classes (spring-seeded cropland, fall-seeded cropland, idle grassland, grazed grassland, hayland, wetland, trees/shrubs, and other). Because wetlands are poorly captured in AAFC’s crop mapping layer, we recalculated base habitat composition after including estimated wetland habitat area from the CanVec hydrology layer116 after adding small wetlands missed by the AAFC and CanVec layers49. This approach yielded the 2016 land-cover map for modeling pintail distribution and reproduction throughout the PPR. To conduct the spatial analysis, we used ArcGIS version 10.4 (Environmental Systems Research Institute, Redlands, California, USA). Detailed methods for developing the land-cover map are provided elsewhere49.
From this layer, we estimated proportional habitat composition in each of 49 conservation-planning landscapes (henceforth, landscapes) covering 574 K km2 comprising the Canadian Prairies (Fig. 4)51. All except three of these are target landscapes that delineate areas of high breeding duck density. The landscapes range in size from 1.68 K–12.7 K km2 and collectively cover an area of 168 K km2. The remaining three landscapes, representing area outside target landscapes in each province, are much larger and range from 58.6 K–183 K km2.
Reproduction model
To quantify the impact of conservation scenarios on pintail reproduction in the PPR, we estimated the age ratio (R) as the number of juvenile females divided by the number of adult females alive at the end of the breeding season. In particular, we estimated R using a reproduction model that was structured as follows:
$$R={S}_{h}times Ctimes {S}_{d}times theta times {S}_{f}^{-1}$$
(1)
where ({S}_{h}) is proportion of hens having hatched a nest (i.e., hen success), C is mean clutch size at hatching, ({S}_{d}) is the probability a duckling survives 30 days after hatching (i.e., to the end of the breeding season), (theta ) is the proportion of hatchlings that are female, and ({S}_{f}) is the probability that an adult female survives during the breeding season. This approach mimics that applied for estimating reproduction in previous avian population models117.
We estimated parameters for the reproduction model based on existing predictive models fit to empirical data from 992 nests that were monitored throughout the Canadian Prairies from 1993–201149,112,118. Hen success (({S}_{h})) was estimated as a function of habitat conditions. Specifically, we first accounted for the spatial variation in pintail breeding pair density within each landscape based on a species distribution model49,118 (Fig. 4) from which we extracted the estimated long-term average (1961–2009) abundance of breeding pairs in each landscape51. Estimated number of breeding pairs and proportional habitat availability in each landscape were used in an existing deterministic model of pintail nest habitat selection, habitat-specific nest survival, and breeding effort (nesting and renesting propensity) in the Canadian Prairies49,112 to estimate the number of hatched nests across the region. We divided hatched nests by the number of breeding pairs to estimate hen success (({S}_{h})), which was then entered in Eq. 1 to estimate age ratio. Age ratio was subsequently used as an input parameter for the continental population model (see “Population model structure and parameters” below). As comparable information is missing from the U.S. portion of the PPR, we assumed that age ratios were equal on both sides of the border.
The remaining parameters for Eq. 1 were directly estimated from empirical data. Average clutch size (C = 8.0, SE = 0.05) was based on direct observations of 2925 nests monitored throughout the Canadian Prairies during 1993–2011 by Ducks Unlimited Canada (DUC; unpubl. data). Mean duckling survival (Sd = 0.505) was based on the average of annual estimates from pintails monitored with radio telemetry in southern Alberta during 1995 to 1996119. Consistent with other models of bird reproduction based on nesting studies117, we assumed that 50% of hatchlings are female. The survival rate for adult females (Sf = 0.81) during breeding was based on a telemetry study of pintails in an agricultural landscape within southern Saskatchewan during 1998–2000120. We estimated standard errors of duckling survival (0.020) and adult female breeding survival (0.016) based on respective coefficient of variation estimates from a large sample of radio-marked mallards in the Canadian Prairies from 27 sites during 1993–2000103.
Scenarios for habitat conservation and pintail harvest
We used the reproduction model to explore the impact of scenarios representing alternate landscape compositions throughout conservation areas of the Canadian Prairies during 2007–2016 (Table 1). The 2016 land-cover map represented the Observed Conditions scenario of empirically derived habitat conditions resulting from investments in habitat conservation. Alternatives to Observed Conditions reflect scenarios varying the amount and spatial distribution of conservation investments targeted at waterfowl habitat. With the exception of including winter wheat in crop rotations (which is limited to areas with spring-seeded wheat), we varied conservation amounts throughout the 46 target landscapes. Each scenario was treated as an instantaneous realization of habitat conditions in the Canadian Prairies that remained constant during the study period and provided the basis for estimating reproduction.
Although the land-cover map provides a comprehensive snapshot of land cover, it does not explicitly identify habitats modified by conservation activities. For simulating alternative scenarios, we made assumptions about habitat composition in each landscape and then manipulated habitat proportions to accommodate specific scenarios. For example, we increased the proportion of pasture and decreased the proportion of spring-seeded cropland by equal amounts to simulate the conversion of cropland to grassland. Sufficient data on land cover and conservation activities throughout the study period were not available for the U.S. portion of the PPR. We therefore assumed that reproduction in the U.S. portion paralleled that of the Canadian Prairies throughout the scenarios.
Two alternatives to Observed Conditions represented changes across all conservation areas. To create the No Conservation scenario (Table 1), we altered landscapes in the 2016 land-cover map to reflect a hypothetical lack of habitat conservation over the 10-year period. Specifically, we reverted all restored or protected nesting habitat (i.e., grasslands, wetlands, and winter wheat) to spring-seeded cropland to represent a landscape before observed conservation activities were applied. The number of pintails per landscape were then reduced based on the area of restored wetlands lost using models developed by Bartzen121. We generated the Increase Conservation scenario by doubling the acreage per conserved habitat type except winter wheat, which was held at the same acreage as for Observed Conditions.
Because of its importance to nesting pintails, we developed three scenarios focused on winter wheat (Table 1). Under No Winter Wheat, all winter wheat on the 2016 land cover map was reverted to spring-seeded cropland to reflect expected conditions in the absence of funding for winter wheat. The Increase Winter Wheat scenario reflects the stated goal of the Prairie Habitat Joint Venture51, to have 30% of the spring-seeded wheat acreage in the Canadian Prairies converted to rotations with winter wheat. We also examined an Increase Winter Wheat – Targeted scenario. Here, we modified the previous scenario by only applying winter-wheat rotations in landscapes with >2.3 pintail pairs km−2 (>6 pairs mi−2) according to estimated population densities predicted from the species distribution model.
In addition to these a priori scenarios, we conducted a post hoc analysis to determine the amount of spring-seeded cropland that would need to be converted to idle grassland in order to achieve specific population sizes at the continental scale. In particular, we adjusted the amount converted while assuming that winter wheat was included in 23 K km2 of crop rotation congruent with the Increase Winter Wheat scenario (Table 1).
Cost estimates for each scenario were based on financial data provided by DUC. Total costs incurred over the 10-year study period were itemized according to the main types of habitat conservation: conversion of spring-seeded cropland to hayland/pasture or idle grassland; increasing amount of cropland with winter wheat in the rotation; protection of existing grasslands and wetlands; and restoration of wetlands.
Along with scenarios for habitat conservation, we considered a range of harvest rates according to existing strategies for harvesting pintails along with the associated uncertainty about actual harvest levels resulting from these strategies. The first strategy assumes a policy of no harvest and closed seasons for hunting pintails. The second assumes a daily bag limit of one pintail. To estimate the range of harvest rates expected under the latter policy, we used annual harvest rates122 for years when the daily bag limit for pintails was set to one (i.e., 1988–1996 and 1998–2008) based on yearly rulings in the federal registry e.g.123. We fitted a generalized linear mixed model to these harvest data, using a logit link function and year as a random intercept. We determined the baseline (i.e., for adult females) harvest rates that respectively yielded the simulated total harvest rates matching the empirically estimated harvest rate. This baseline harvest rate was used as an input to the population model, which accounts for differential vulnerabilities among age and sex cohorts and crippling loss19.
Population model structure and parameters
We examined effects of changes in age ratio, as mediated by scenarios for harvest and habitat conservation, on equilibrium population size of pintails across their core breeding and wintering regions in North America (Fig. 4). We now briefly summarize the structure of the population model, as the details are described elsewhere19. The population model includes two age classes, both sexes, and the five core regions. Core breeding regions include the entire PPR (including portions in Canada and in the U.S.), Alaska, and the northern unsurveyed area. The latter region includes low-quality habitats within the PPR and in northern boreal portions of Canada beyond the PPR. Although this area spatially overlaps the PPR, it is modeled as a separate region to reflect important characteristics of the species distribution and behavior. The western wintering region includes the Pacific Flyway states of California and Oregon, and the central breeding region includes the Central Flyway states of Texas and Louisiana. We updated the structure and parameters of the original model to match current understanding about pintail population dynamics.
First, we changed the initial population size at the start of breeding from 3.2 M to 4.0 M as the sum across all three regions. The latter value is the long-term average of the breeding population based on annual surveys (1955–2014), which is the NAWMP46 population goal for pintails. We then removed density-dependent reproduction within breeding regions. The only evidence for density dependence on the breeding grounds is at the continental scale19, and regional-scale density dependence has not been detected during long-term studies within the PPR112 nor within Alaska (P. L. Flint 2010, oral communication). This modification renders the model with two density-dependent mechanisms. One occurs during spring migration when an increasing proportion of adults settle in poor-quality breeding habitat as abundance increases. The other density-dependent process in the model is the reduction of post-harvest survival with increasing abundance on the wintering grounds19.
The estimated age ratio (computed from the reproduction model) for the Observed Conditions scenario was significantly lower than the one used in the original population model. We therefore rescaled age ratios for the remaining breeding regions based on our new estimate for PPR from the Observed Conditions scenario. In particular, we multiplied the original age ratio ({R}_{i}) by ({R}_{PPR}^{{prime} }/{R}_{PPR}), where i indexes the other two breeding regions, ({R}_{PPR}^{text{‘}},)is the estimate of age ratio for PPR based on the Observed Conditions scenario in the current study, and ({R}_{PPR}) is the baseline estimate used in the original population model. This calculation is based on the assumption that age ratios in the original model were being overestimated by the same percentage across regions.
Last, we modified several survival rates. We computed a breeding-season survival rate for males of 0.96 (Agresti–Coull 95% confidence interval: 0.89, 0.99)124,125, which was based on 76 of 79 radio-marked pintails who survived from early April through early July in landscapes within southern portions of Manitoba and Saskatchewan during 1998 and 1999126. This is lower than the original estimate, which was only based on paired males. We also reduced natural mortality rate during fall (i.e., from the start of fall migration to the end of the hunting season) for all cohorts by 0.04. This reduction in fall mortality leads to an annual female survival rate of 0.67, which matches the estimate for the Western and Central Flyways32. The modified population model allowed us to estimate equilibrium abundance at the continental scale under each scenario.
Analysis
For each scenario, we estimated the following parameters within the PPR: conservation cost, habitat availability, hen success, and age ratio at the end of the breeding season. At the continental scale, we projected equilibrium population size at the start of breeding across all three core breeding regions as a function of age ratios. The set of age ratios was based on the modeled estimate for each of the a priori scenarios for habitat conservation along with those predicted under the post hoc scenarios.
Although the model is deterministic, we ran each scenario using the mean and 95% confidence limits for age ratio, male survival during breeding, and harvest rate. We held the remaining parameters constant, because empirical data for computing confidence intervals for these are lacking. To estimate standard error for age ratio, we integrated uncertainties about clutch size, hen success, duckling survival, and female breeding season survival within the reproduction model by using the delta method127. We then multiplied this standard error by 1.96 to obtain the upper and lower prediction intervals for age ratio under each habitat conservation scenario. To model the 95% confidence interval for harvest rate for all individuals under a daily bag limit of one, we extracted the 2.5th and 97.5th quantiles from 1000 bootstrap iterations of the mixed logistic regression using the bootMer function in program R128. The method for estimating the confidence interval breeding survival of adult males is given under “Population model structure and parameters”, above.
The analysis was conducted using SAS version 9.4 (SAS Institute, Cary, North Carolina, USA8) for the reproduction model and program R128 for the remaining parameters and population model. All monetary values are given in 2016 USD.
Source: Ecology - nature.com

