Long-term changes in coral skeleton nitrogen isotopes
The composite CS-δ15N records for Havannah Island and Pandora Reef (Fig. 2a, b) were significantly and positively correlated (r = 0.56, p < 0.001) during the 143-year period over which they overlapped (i.e. 1863–2005) and their long-term average CS-δ15N values were also similar (6.0 ± 0.7‰ and 5.8 ± 0.6‰, respectively). Shifts in CS-δ15N within each core therefore reflect ecosystem-level changes in external δ15N rather than physiological variability within the individual corals. First, we describe the long term changes in the CS-δ15N records before examining the reasons that may have caused these changes.
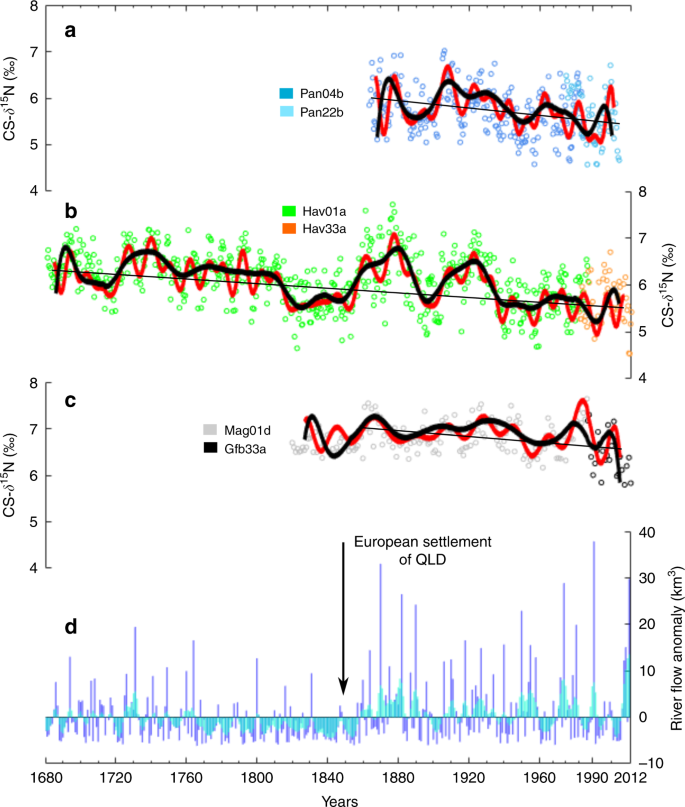
a Raw data from the two Pandora Reef cores (Pan04b and Pan22b—open circles) overlain with low-pass-filtered CS-δ15N (black line = <25 yr frequencies removed) and high-pass-filtered CS-δ15N (red line = <10 yr frequencies removed). The straight line is the regression for the composite record (slope = 0.004‰ yr−1). b Raw data from the two Havannah Reef cores (Hav01a and Hav33a—open circles) overlain with the low and high pass filtered CS-δ15N (black and red lines, respectively). The straight line is the regression for the composite record (slope = 0.002‰ yr−1). c Raw data from the two Magnetic Island cores (Mag01d46 and Gfb33a—open circles) overlain with the low and high pass filtered CS-δ15N (black and red lines, respectively). The straight line is the regression for the composite record between 1860 and 2011 (slope = 0.002‰ yr−1). d Reconstructed Burdekin River flow anomalies50, data are annual (October–September) water year values (km3) normalised to the overall mean flow between 1680 and 2011. Blue lines are the annual values, and blue shading is the 3-year running mean.
The patterns of CS-δ15N variability in corals from both reefs matched reconstructed Burdekin River flow derived from coral luminescence data50, indicating that river runoff led to increased CS-δ15N, and that dry periods led to decreased CS-δ15N (Fig. 2a, b, d). The correlations were generally better when short-term variability was excluded, and prior to 1940 (Supplementary Table 1). These relationships suggest that N enrichment following terrestrial runoff events increases CS-δ15N, supporting the notion that bulk terrestrial N has a relatively high δ15N, or that increased N availability increases water column N through trophic or metabolic interactions51. During dry periods CS-δ15N decreases, suggesting the increased contribution of N2 fixation to the inshore N pool. The increase in N2 fixation during dry periods has been observed in the modern GBR33 and fits the hypothesis that in the coastal GBR N can become limiting to the point where diazotrophs can outcompete other phytoplankton30.
Two lines of evidence suggest that the patterns in N cycling at the study sites have been altered by anthropogenic activity since the 1850s. Firstly, there is a significantly decreasing trend in CS-δ15N from 1680 to 2012 (Fig. 2a, b), and secondly there is a shift in the response of CS-δ15N to rainfall in the latter half of the 20th century that is not observed during pre-European wet periods (Fig. 3a, b). In the first 100 years of the Havannah Island record (1680–1780) the mean CS-δ15N was 6.4 ± 0.5‰, significantly higher (Student’s t-test, p < 0.001) than the last 100 years of the record (mean CS-δ15N of 5.8 ± 0.4‰). The mean CS-δ15N between 1940 and 2012 was lower still with a mean of 5.6 ± 0.4‰, representing a 0.8‰ decrease compared to the first 100 years of the record (double the analytical precision of the CS-δ15N method). In addition to changes in mean CS-δ15N, the Havannah Island record showed a significantly decreasing CS-δ15N trend (Mann–Kendall trend test, p < 0.001). The Pandora Reef record also had a significant negative trend in CS-δ15N between 1863 and 2012 (Mann–Kendall trend test, p < 0.001), and while this core does not capture the full extent of climatic variability evident in the Havannah Island record, it can still speak to the changes occurring in the latter half of the 20th century.
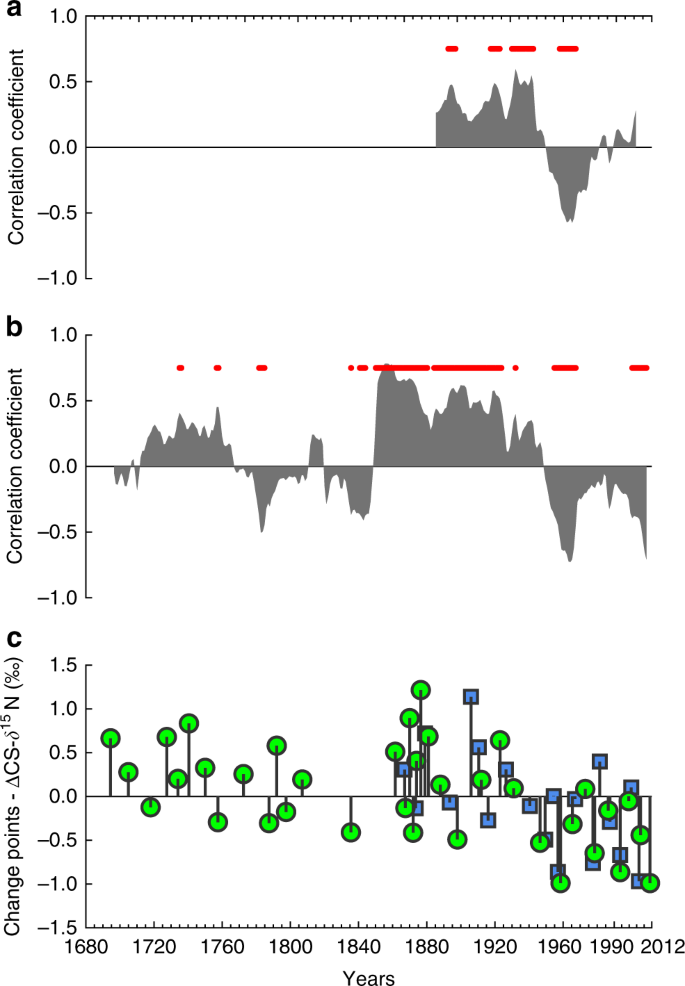
a Correlation coefficients for a moving correlation (30-year window) between the annual Pandora Reef CS-δ15N record and Burdekin River flow. Red dots show significance at the 95% level. b Correlation coefficients for a moving correlation (30-year window) between the annual Havannah Island CS-δ15N record and Burdekin River flow. Red dots show significance at the 95% level. c Change points for Pandora Reef (green) and Havannah Island (blue) composite CS-δ15N records. Change point values are normalised to the overall mean CS-δ15N of each core.
Notably, a similar decreasing trend in CS-δ15N was not recorded in a previous long core from Magnetic Island (1820–1987), some 60 km south of Havannah Island46. While the lack of change in CS-δ15N for the Magnetic Island core was used as evidence that there was no N enrichment in the coastal GBR as a result of European settlement46, the absence of a decreasing trend warrants further investigation. In the present study we updated the previously published Magnetic Island CS-δ15N record with a 25-year short core (1987–2011) from the same reef. A trend test over this new composite record revealed a significant decrease in CS-δ15N, but only between 1860 and 2011 (Fig. 2c). In the century before 1860 the central inshore GBR experienced lower than average river runoff (Fig. 2d), which according to the Havannah Island record, resulted in a prolonged decrease in CS-δ15N (Fig. 2b). Such a decrease suggests a period of severe N limitation and a greater reliance on N2 fixation. Because the Magnetic Island record does not capture the wetter period prior to 1780, we started the trend test from 1860 and not 1820.
The timing of the decrease in CS-δ15N in the updated coral record for Magnetic Island is also later than in the Pandora Reef and Havannah Island records. This may in part be due to the removal of the impacts of dredge spoil on Magnetic Island corals, which may have been masking any decrease in CS-δ15N. Coral communities on Magnetic Island have been exposed to dredge spoil since the 1880s52, but significant efforts to improve the management of dredge spoil discharge only began in the 1990s53. Alternatively, the stability of the Magnetic Island record between 1820 and 1987 may be due to the antagonistic effects of increased δ15N in terrestrial N runoff (higher CS-δ15N) and higher rates of coastal N2 fixation (decreased CS-δ15N) (see discussion below). Given the proximity of Magnetic Island to the Burdekin River, it may be more influenced by high terrestrial N than the two reefs further north. In any case, taken together, all three coral records from the same coastal region of the GBR suggest a decrease in CS-δ15N in the latter half of the 20th century.
In addition to this long-term decreasing trend in CS-δ15N, the Havannah Island and Pandora Reef coral records also show a shift in the relationship between CS-δ15N and Burdekin River flow between 1860 and 2012. Between 1860 and 1940 CS-δ15N and Burdekin River flow anomalies are positively correlated, with peak river flow corresponding with increased CS-δ15N and vice versa (Fig. 3a, b). For the Havannah Island core, these correlations are mostly significant. After 1940, both the Havannah Island and Pandora Reef CS-δ15N records are poorly, or inversely, correlated with Burdekin River flow anomalies (Fig. 3a, b). A similar pattern of poor and/or inverse correlation between CS-δ15N and Burdekin River flow anomalies can also be seen between 1770 and 1850 in the Havannah Island record (Fig. 3b), but this is a particularly dry period with mostly below average river flow (Fig. 2d). Between 1680 and 1770 the average Burdekin River flow anomaly is close to the long-term average (i.e. ~0 km3) and there is a positive correlation between CS-δ15N and Burdekin River flow anomalies, just like the period between 1860 and 1940. Therefore, the period between 1940 and 2012 stands out from previous periods of comparable Burdekin River runoff. This is confirmed with change point analysis which shows an increase in the number of CS-δ15N minima after 1940 in both the Havannah Island and Pandora Reef records, and a reduction in the magnitude of the positive change points after 1940 (Fig. 3c). The sum of our evidence therefore suggests that the CS-δ15N is lower after 1940 than during any other previous period of comparable river flow.
Reasons for decreased CS-δ15N in the inshore GBR
The decrease in CS-δ15N in the latter half of the 20th century implies that a new source of N with a lower δ15N has been added to the coastal GBR N budget. The two possible sources are N2 fixation, or terrestrial N that has been modified by the addition of fertiliser (which can have a low δ15N54). Rainfall is included as a terrestrial source as it deposits atmospheric N back on land which then flows to the coastal GBR. For the Burdekin River catchment the δ15N of undisturbed forest soils is ~6.3‰, however modified soils in the modern Burdekin River catchment have an average δ15N of ~5.8‰, possibly reflecting the addition of artificial fertilisers since the 1930s55. Therefore, the observed decreases in CS-δ15N in the coral records could simply be attributed to an increase in the amount of fertiliser used in the Burdekin River catchment, since European settlement (which decreases the δ15N of terrestrial N). However, directly linking CS-δ15N with terrestrial δ15N ignores the complex modifications in isotope abundances that can occur in agricultural systems, particularly when surface and groundwater are linked38,45, like they are in the Burdekin River catchment. We propose that the δ15N of terrestrial N reaching the coastal GBR is likely to be higher than the δ15N of N in soils, and that even though fertiliser N may have a low δ15N, by the time this N has moved through the landscape its δ15N has been significantly altered by biological processing.
To constrain the δ15N of modern-day terrestrial N reaching the central inshore GBR we compared the δ15N of the total dissolved N pool (δ15N-TDN) before and after a major flooding event (Supplementary Fig. 1) in the central inshore GBR (Sites 1–6 in Fig. 1). Total dissolved N is a mix of terrestrial dissolved organic N (e.g. from soils), dissolved organic N released from particulate N in the water column, and dissolved inorganic N from surface/groundwater sources. The δ15N-TDN therefore integrates the δ15N of the different N pools in terrestrial discharge or coastal waters, and also captures the isotopic fractionation that occurs during N transformation between the pools (Supplementary Fig. 2). As confirmation of this we measured the δ15N of particulate material before the flooding event (Sites 4–6), finding that it was within 0.5‰ of the δ15N-TDN at the same sites (Supplementary Table 2). As such, the δ15N-TDN should be a good representation of the δ15N of N available to coastal corals.
The measured δ15N-TDN in the Burdekin River flood plume (March 2019) ranged from 6.2 ± 0.1‰ at the river mouth, to 4.6 ± 0.6‰ at Site 6 (Supplementary Table 2). Prior to the flood event (November 2018) the average δ15N-TDN at Sites 4–6 was 4.1 ± 0.7‰ (Supplementary Table 2). The flood plume sampling occurred about a month after the main discharge event, which means there would already have been significant mixing of coastal water with river runoff. To determine the δ15N-TDN of the terrestrial endmember, we used an isotope mixing model of measured concentrations and δ15N-TDN in water samples collected before and after the flood event (see Supplementary Note 1). With this approach the δ15N-TDN of terrestrial N was calculated to be 8.1 ± 1.1‰, this is higher than the δ15N of catchment soils55 and of fertiliser N54. In general CS-δ15N is up to 2‰ higher than its N source, so given that the average CS-δ15N was 5.6‰ between 1940 and 2012, the δ15N-TDN of terrestrial N would need to be between 3.6‰ and 5.6‰ if it was to be the dominant source of N for corals in that period.
Based on our rather limited assessment, it would appear that the calculated δ15N of terrestrial N is too high for it to have caused the decreases in CS-δ15N observed in the coral records. Other studies also support the idea that the δ15N of terrestrial N has increased with increased application of N to adjacent farming land. For example, the δ15N in terrestrial material recovered from a Magnetic Island coral skeleton46 increased from 2.5‰ to 9.5‰ between 1820 and 1987. Another study measured the δ15N of acid insoluble material (which is effectively terrestrial N) in coral skeletons from the southern coastal GBR, finding values of around 8.5‰, and as high as 13.6‰, during flood events56,57. These same studies reported δ15N values of particulate N in catchment runoff of up to 9.5‰. Unfortunately there are very few studies reporting the δ15N of terrestrial N reaching the coastal GBR, but the evidence both from our study and others support the idea that the δ15N of terrestrially derived N is too high to be the driver of reduced CS-δ15N observed in the coral records from the central inshore GBR.
The other possible driver of reduced CS-δ15N in the Havannah Island, Pandora Reef, and Magnetic Island coral records is N2 fixation. To try and quantify the amount of N entering the coastal GBR through N2 fixation we developed a second isotope mixing model (see Supplementary Text 2 for a full description). The model assumes that the N available for consumption by coastal corals comes from both terrestrial N inputs (measured as δ15N-TDN, see above) and N2 fixation. The average CS-δ15N value between 1940 and 2012 for the Havannah Island coral was used to determine the contribution of these two sources to the coastal N pool (after accounting for fractionation between the coral and the N source). Outputs from the mixing model show that between 1940 and 2012, the minimum and maximum possible contributions of N2 fixation to the inshore N pool are 17% and 55% (Fig. 4). Using the average δ15N-TDN value for the flood plume waters of 8.1‰, and accounting for fractionation during uptake of N by corals, N2 fixation was constrained to within 27% and 50% of annual N inputs at the study site (Fig. 4).
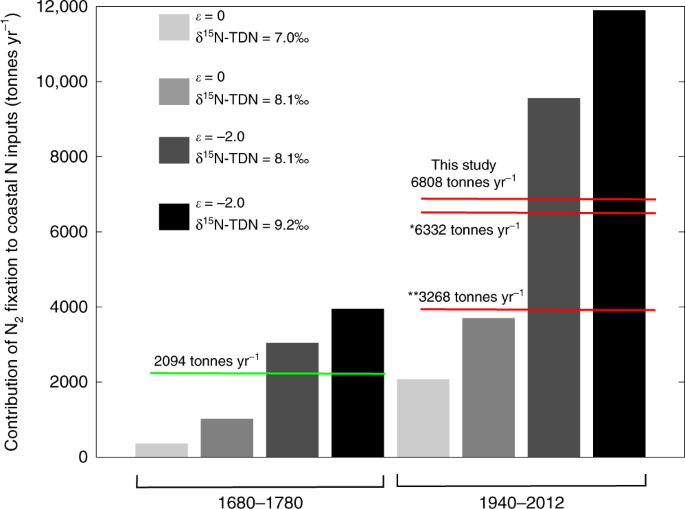
Four scenarios are presented for each time period, these reflect variability in the isotopic fractionation of N during assimilation into coral skeletons (given as ε, which is known to vary between 0‰ and −2‰68), and the δ15N-TDN calculated for terrestrial N (8.1 ± 1.1‰). The four scenarios are the low and high extremes of N2 fixation (i.e. ε = 0‰/δ15N-TDN = 7‰, and ε = −2‰/δ15N-TDN = 9.2‰, respectively), and N2 fixation resulting from ε = 0‰/δ15N-TDN = 8.1‰, and ε = −2‰/δ15N-TDN = 8.1‰ (where 8.1‰ is the average δ15N-TDN calculated for terrestrial N). The green line is the average of the pre-European period and the red lines are values for the modern GBR. The * value is from Messer, Brown et al. 31, and the ** value is the average of Bell, Elmetri et al. 58 and Furnas, Alongi et al. 26.
While our data shows that the proportional contribution of N2 fixation to the coastal N pool has increased with anthropogenic inputs, it cannot tell if the rate of N2 fixation has increased. For instance, if terrestrial N is being preferentially lost after discharge, then the N from N2 fixation may make up a larger fraction of the coastal N pool without the rate of N2 fixation actually increasing over time. To convert the fractional contributions into actual amounts of N entering the system through N2 fixation, we used the modelled terrestrial N input values of Waters, Carroll et al. 14 for the Burdekin and Herbert Rivers (Supplementary Note 3). We estimate that the average annual input of N from N2 fixation to the central inshore GBR between 1940 and 2012 ranged between 2073 and 11,897 tonnes yr−1, with an average value of 6808 tonnes yr−1 (Fig. 4). This is the same order of magnitude as N2 fixation estimates from Furnas, Alongi et al. 26 (3225 tonnes yr−1, which includes water column and sediment rates), the range of values reported by Bell, Elmetri et al. 58 (average of 3311 tonnes yr−1, water column rates only), and the estimates of Messer, Brown et al. 31 (6332 tonnes yr−1, water column only). Note that our estimate of N2 fixation is calculated as a proportion of the annual terrestrial N load debouched by the Burdekin and Herbert Rivers, whereas the reported literature rates are up-scaled from areal or volumetric rates (see Supplementary Note 3 for a description of the scaling procedure). Furthermore, the literature values relate to coastal regions that may not include our study site. Nevertheless, the similarity between our rates and literature values provides some vindication of our model calculations.
Next we calculated the annual rate of N2 fixation in the first 100 years of the record. This period was selected because it is the only interval prior to European settlement that has comparable, albeit lower, rainfall to the modern GBR. To perform the mass balance calculation we used the same mixing model as for the modern GBR, but adjusted the CS-δ15N to match the average value between 1680 and 1780 (i.e. 6.4‰). We assumed that the δ15N of terrestrial discharge (δ15N-TDN) was the same as the modern GBR (i.e. between 7‰ and 9.2‰), which actually overestimates the pre-European rate (because δ15N-TDN was probably lower). Similar to the calculation for the modern GBR, we used published estimates of annual terrestrial N inputs prior to European settlement14 to deduce a value for N produced through N2 fixation (Fig. 4).
The average modelled estimate of N2 fixation for the central inshore GBR between 1680 and 1780 was 2094 tonnes yr−1 (green line in Fig. 4). This is lower than estimates for the modern GBR (red lines in Fig. 4). Even acknowledging the wide range in the N2 fixation estimates, it appears likely that the quantity of N imported into the coastal GBR has increased since pre-European times. This represents the first evidence that N2 fixation in the coastal GBR is higher now than prior to European settlement. We hypothesise that increased terrestrial runoff has increased denitrification and decreased the N:P of the coastal GBR since European settlement. This in-turn has manifested as an increase in the amount of N2 fixation now occurring in coastal waters.
Implications for coastal nutrient management in the GBR
Studies on N2 fixation conducted in the early 1990s reported increased rates in the coastal GBR relative to the 1930s22,23. The increase in N2 fixation was thought to import new N and organic matter into the system, potentially stimulating inorganic N availability and enhanced primary production. As such, the observed increases in N2 fixation were used as evidence that the GBR was heading towards widespread eutrophication. However, assessments of coastal primary production, paleo-reconstructions, or large-scale N budgets for the GBR do not support this26,34,59. Nevertheless, these early N2 fixation studies do raise a crucial point, what will happen to the new N imported into the coastal GBR through enhanced N2 fixation? From a benthic biogeochemical perspective, an increase in organic N delivery to sediments following N2 fixation is likely to fuel sediment anoxia and enhance denitrification, perpetuating N limitation. As P continues to accumulate, eventually the amount of N entering through N2 fixation will overwhelm the denitrification capacity of the system, at which point water column DIN availability will increase and classic eutrophic conditions may take hold. Current estimates show that denitrification rates exceed N2 fixation rates in the inshore GBR26, but it is not clear how long this will persist. While much of this discussion is speculative, it does highlight the importance of reducing terrestrial P discharge to the coastal GBR. Our data suggests that reducing terrestrial P discharge and availability would short-circuit the N2 fixation feedback loop and help avoid future acute and chronic eutrophication in the coastal GBR.
Source: Ecology - nature.com

