AM generation
We firstly pre-mined the available data for further estimation of domestic generation of AM: First, lifetime distribution function of all the relevant products is determined by Supplementary Text 3 and Table 13; Second, data regression is enabled with Supplementary Figs. 7-9 for the annual net production and imported scraps until 2050. In this year China was attempted to become one moderately developed country; and last, the incremental error or range are configured for the estimation of future demand and importation (Supplementary Tables 11, 14). Accordingly, domestic generation of WEEE, ELV, and WWC are uncovered (Supplementary Fig. 10 and Fig. 2). The weight of WEEE on average was 4.67 million tons (1 Mt = 1000 kt = 106 tons; 1 ton = 103 kg) in 2010, but it will reach 27.22 Mt in 2030 and 51.60 Mt in 2050. The distribution of WEEE types in China is also evolving in its economic and material waste profile through the period 2010–2050. In 2015, the four types, by weight, were AC, DPC, monitor, and RF, accounting for 73% of the total WEEE. However, in 2020, the four types, by weight, will be DPC, AC, RF, and monitor, accounting for 76% of total WEEE. In addition, by 2030, the four types are expected to be AC, DPC, RF, and WM, accounting for 81% of total WEEE. The weight share of the remaining WEEE types has been shrinking since 2010.
For ELV, a continued increase also can be found both in weight and in quantity (Fig. 2). Actually, since 2009 China has become the largest generator and seller of vehicles. In the end of 2015, the total registered vehicles in service reached 279 million (M)35, exceeding 264 M of the U.S.36. The total ELV reached 11.01 Mt in 2010, and three-fold rise will occur in 2017. Later, it will reach around 61.37 Mt in 2030 and 97.10 Mt in 2050. Thus, the average annual amount of ELV will be over 2 Mt in 2010–2050. Among the main large ELV, the share in 2010 was nearly 54%, 18%, 9%, 2%, and 0 for CT, PV, RV, tractor, and EV, respectively. With respect to WWC, those weights will remain under 5 Mt before 2025, and then dramatically increase to 33 Mt in 2040 (Fig. 2).
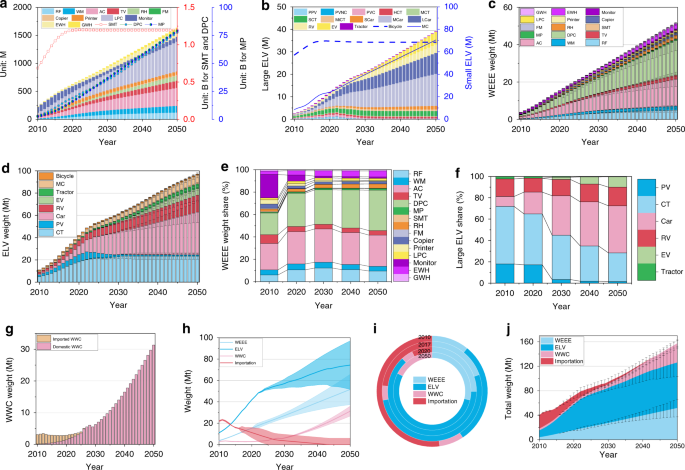
a WEEE quantity. b ELV quantity. c WEEE weight. d ELV weight. e WEEE weight share. f ELV weight share. g WWC weight. h Weight range. i Total weight share. j Total weight. Note: WEEE consist of AC, WM, RF, TV, DPC, LPC, MP, SMT, RH, printer, copier, monitor, EWH, GWH; Large ELV consists of PPV, NPV, PVC, HCT, MCT, SCT, MiCT, SCar, LCar, RV, EV, and tractor; Bicycle and MC are classified as small ELV; And WEEE, ELV, and WWC make up AM. AC, air conditioner; AM, anthropogenic mineral; CT, cargo truck; DPC, desktop personal computer; ELV, end-of-life vehicle; EV, electric vehicle; EWH, electric water heater; FM, fax machine; GWH, gas water heater; HCT, heavy cargo truck; LCar, large car; LPC, laptop personal computer; M-CRT, CRT monitor used for mainframe; M-FDP, FDP monitor used for mainframe; MC, motorcycle; MCar, medium car, MCT, medium cargo truck; MiCT, mini cargo truck; MP, mobile phone; NPV, New-registration passenger vehicle; PC, personal computer; PCV, passenger civil vehicle; PPV, private passenger vehicle; PV, passenger vehicle; PVC, Private vehicle for civil purpose; RF, refrigerator; RH, range hood; RV, refit vehicle; Scar, small car; SCT, small cargo truck; SMT, single-machine telephone; TV, television; WEEE, waste electrical and electronic equipment; WM, washing machine; WWC, waste wiring and cable.
Regarding the importation, steel scrap, copper scrap, aluminum scrap, and plastics scrap are the majority of imported AM. In July 2017, China issued a rigorous policy of phasing out waste import, including some unrestricted import of waste (Supplementary Table 10)37. The linear fitting has been employed to model the imported e-waste and scraps from 2010 to 2050 (Supplementary Fig. 9 and Table 11). Illegal importation of e-waste will shrink and disappear in 2020s. The total importation of scraps was around 21 Mt in 2010, but will dramatically decrease to 1 Mt in 2040. In weight of imported scraps, plastics scrap is leading (verified by Brook et al. studies38), followed by steel scrap, copper scrap, and aluminum scrap (Fig. 3e).
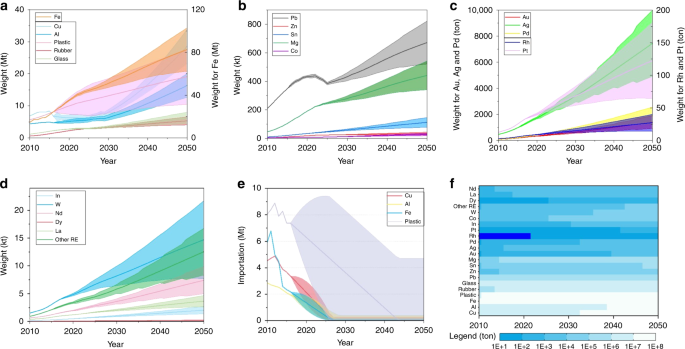
a base material. b Pb, Zn, Sn, and Mg materials. c precious metals. d rare metals and rare earths. e imported resources. f average resource map. Note: Resources cover the base material (like valuable metal, plastic, and rubber), precious metals, rare metals, and rate earth (RE) elements. The imported resources primarily comprise Cu, Al, Fe, and plastic. The shadowing area indicates the range. For the color map of Rh, deep blue color indicates no data.
Totally, the weight of the yearly-generated AM in China was about 40 Mt in 2010. Driven by the large expansion of WEEE, ELV, and WWC, total generation weight will reach 71 Mt in 2020, 101 Mt in 2030, and 176 Mt in 2050 (Fig. 2). The average increasing amount in 2010–2050 will be 3.4 Mt per year, and over one half will be provided by ELV, thus ELV may impose more stresses and tensions on government and industry than WEEE and WWC in the future. In addition, importation will shrink when its share in total AM is cut down from 51% in 2010 to 7% in 2025 (Fig. 2).
Evolution of valuable resources in AM
When some products reach their EoL, a large quantity of valuable resources is inevitably encased in AM39, regardless of whether in hibernating stock or not9,40. The amount of encased eleven base materials (e.g., Cu, Al, Fe, Co, Pb, Zn, Sn, Mg, plastics, rubber, and glass), five precious metals (e.g., Au, Pd, Ag, Pt, and Rh), two rare metals (e.g., In and W), and five rare earths (including Nd, Dy, La, Y, and Eu) in yearly-generated AM can be easily determined (Supplementary Fig. 11). Almost all mineral resources encased in WEEE, ELV, and WWC have been constantly growing since 2010, and can be expected to continue to rise, at least until 2050.
Totally, for base materials, eight metals, except Pb, maintain the increasing tendency despite a rapid decline of importation. In 2010, the mineral resources of Cu, Al, Fe, Zn, Co, Sn, and Mg were approximately 7.03 Mt, 4.46 Mt, 14.69 Mt, 0.78 kt, 5.82 kt, 0.16 kt, and 46 kt, respectively, but they will rise to 28.52 Mt, 16.35 Mt, 82.63 Mt, 10.65 kt, 23.49 kt, 2.23 kt, and 441 kt on average by 2050, respectively (Fig. 3). The amount of Co and Fe will lead in the increasing rate among all the base materials due to the dramatic and continuing boom of battery and vehicle. The popularity of display substitution and the build-up of vehicles, in particular used with lead-acid battery, have resulted in a peak of 4.3 Mt for Pb generation around 2020, verified by the previous studies41,42. Simultaneously, the amount of plastic, glass, and rubber will increase around 55%-fold, 8-fold, and 7.7-fold from 2010 to 2050 (Fig. 3).
The total precious metals are always keeping the growth trend in the year of 2010–2050. The amounts of Au, Pd, Ag, Rh, and Pt were only 89.95, 92.98, 473.84, 2.98, and 6.96 tons, respectively in 2010, but they will grow roughly 15-fold, 19-fold, 14-fold, 8-fold, and 8-fold in 2050 (Fig. 3c). Actually, around global 85% Rh, 50% Pd, and 43% Pt were used in automobile catalyst scraps43. The same ascending trend in total rare metals and rare earth remains as the other metals. The amounts were approximately 0.15 kt, 26.75t, 0.44 kt, and 0.92 kt for In, W, Nd, and other rare earth, respectively, but they will rise to 2.04 Mt, 366 tons, 5.38 kt, and 12.52 kt by 2050, respectively (Fig. 3).
Economic potential of AM
From an economic perspective, the large amount of valuable resources accumulated in AM is also enhancing the recycling potential44. Despite of the wide range imposed by market price of resource, the average of economic potential from urban mining has been evolving from roughly 74 billion US$ in 2010, to an anticipated 170 billion US$ in 2030 and 428 billion US$ by 2050 (Fig. 4a). During the evolution of recycling potential until 2050, base materials and precious metals have the major economic potential. But the former will drop from 90% in 2010 to around 70% in 2030–2050, and the latter will sharply go up from 4% in 2010 to 15% in 2030–2050 (Supplementary Fig. 12). The remaining recycling potential is predominantly provided by rare metals. Furtherly, the highest-value materials—Cu metal—comprise on average 40%, followed by Au (5–18%), In (4–13%), Al (8–13%), Pd (2–11%), and plastic (5–10%). As a result, Cu, Al, plastic, and Au is currently major recycling targets from AM, but in the future Cu, Au, In, and Al will become the crucial valuable materials (Fig. 4b).
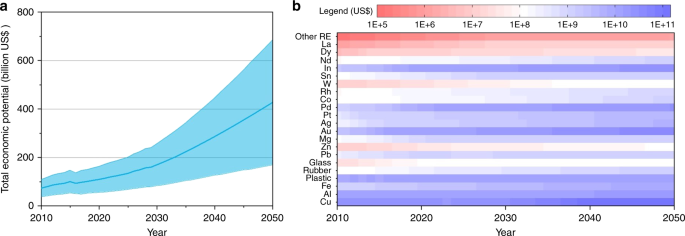
a economic value of total annual AM. b economic potential map of materials. Note: the shade of light blue indicates the range of recycling potential. RE, rare earth.
Meeting potential of AM supply
The future consumption of product is theoretically equal to net addition to in-use stock, which is the difference between the demand and the generated AM (Eq. 7 and Supplementary Fig. 1). All the relevant materials are also chosen to uncover the future resource consumption imposed by EEE, vehicle, and wire and cable. Cu, Al, Au, and Pd will maintain the growth until 2030 and afterwards keep stable (Fig. 5), which is attributed to the flourish of wiring and cable and EEE45. Pb demand increased from 0.91 Mt in 2000 to 7.75 Mt in 201441, but Pb, Fe, Zn, and rubber are quickly decreasing until 2020, and afterwards almost keep the unchanged range while vehicle and EEE are approaching the final saturation; Co will increase and reach the peak in 2030 because the cathode material in lithium-ion battery is gradually substituted from lithium cobalt oxide to lithium nickel cobalt aluminum oxide and lithium iron phosphate in electric vehicle and consumer electronics46; Other fifteen materials of future consumption have entered a stabilized phase. The plastic, for instance, will always maintain about 6 Mt in 2010–2050 while the falling importation and the increasing production will mingle together.
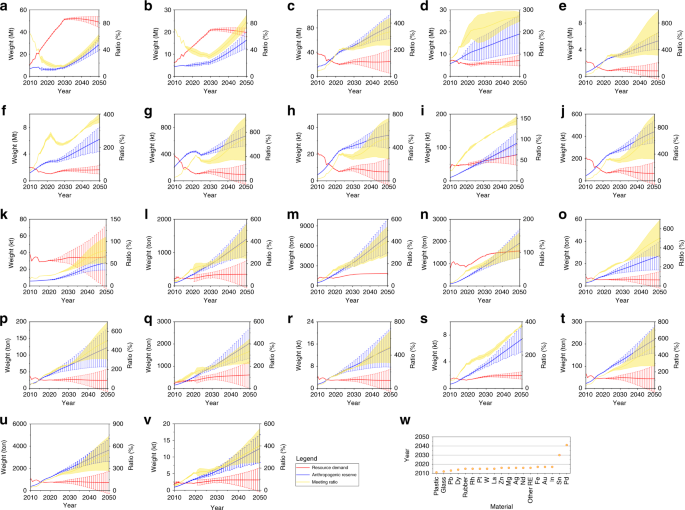
a Cu. b Al. c Fe. d Plastic. e Rubber. f Glass. g Pb. h Zn. i Sn. j Mg. k Co. l Au. m Ag. n Pd. o Rh. p Pt. q In. r W. s Nd. t Dy. u La. v other RE. w Meeting time of various materials. Meeting ratio is the value of anthropogenic mineral dividing resource consumption. The shade of light yellowish-brown indicates the range of recycling potential. Rank of various materials is based on the value of meeting time, which is the year while the meeting ratio equals 1.
We further uncover the supply potential of AM. With the dramatic rise of AM generation and the gradual saturation of material consumption, the potential supply from AM is becoming possible to overtake the resource consumption of three product groups (Fig. 5). Although we are currently still far from a closed-loop society owing to low recycling rate47, a rapid advancement is indeed arising for regulation, policy, and technology of circular economy and urban mining. The highly-efficient collection and the cutting-edge recycling will significantly enhance the recycling rate in the future. Thus, if substantial recycling, eighteen materials of AM could meet their demand before 2020, and in 2050 they probably provide over two-fold consumption. The meeting time of Sn and Pd will be approximately 2030 and 2041, respectively. Although Cu, Al, and Co of AM cannot meet their potential consumption by 2050, the disparity gap between their consumption and AM will be greatly reduced in the following decades (Fig. 5w). Consequently, AM supply has a growing potential to meet their future resource consumption.
Source: Ecology - nature.com
