The methodological framework of our study was shown in Fig. 1. We firstly reviewed air pollution control policies and measures between 2013 and 2017. We assessed the changes in exhaust emissions and ambient air pollutants during the study period. The reduction in mortality and morbidity from improved air pollution were quantified. Finally, associated economic benefit was estimated in US dollars. We further projected the future benefits with a scenario of PM2.5 concentration down to the national ambient air quality standards Grade-II (15 μg/m3)25.
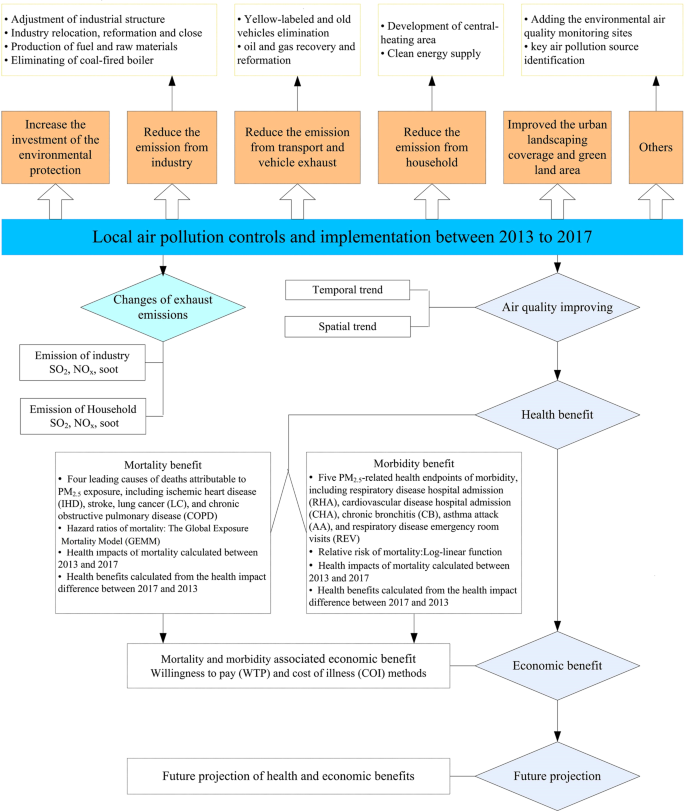
Methodological framework of the study.
Background information for Jinan
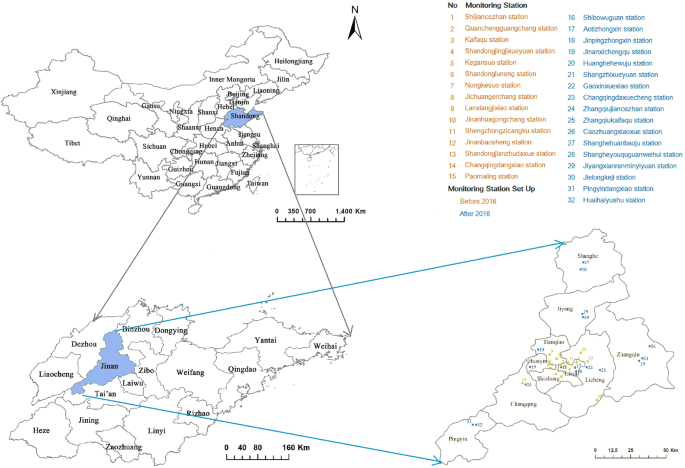
Jinan, the capital of Shandong province, comprises a total of 8,177.21 km2 with ten districts. It is located at 36.40°N latitude and 110.00°E longitude, along the coast of the Yellow River, downstream of the Central China Region (Fig. 2). It has become the core connection center for two economic zones: Beijing-Tianjin-Hebei Regions and Yangtze River Delta. In the past few years, Jinan has experienced rapid industrialisation and urbanisation. Nearly 40% of the gross domestic product (GDP) in Jinan was contributed by typical industries, including power plant, machinery manufacture, textile and steel production, chemical manufacturing, light industry, and building materials21. The GDP in Jinan was US$108.4 billion in 2017, increased by 37.70% from 2013 (US$78.7 billion). It has a stable population growth from 7.0 million in 2013 to 7.3 million in 2017, with nearly 15% of older population (65 years and older)26 (Fig. S1).
Air pollution control measures
In responding to the national APPCAP and Ten Tasks, Jinan government released the Jinan Air Pollution Prevention and Control Action Plan (phase I) on 12 December 201327 and Jinan Air Pollution Prevention and Control Action Plan (phase II) on 21 October 201628, in which specific goals and detailed control measures were introduced to achieve the national goals set in the APPCAP. Jinan has also developed a range of local policies and measures to reduce air pollutants emissions in the last few years29. We reviewed all air pollution control policies in Jinan between 2013 and 2017, including documents from Jinan Environmental Protection Bureau29, Jinan Statistical Yearbook26, Shandong Statistical Yearbook30,31,32,33,34, and National Statistical Reports35. We also collected the air pollution control measures from the transportation sector from the Yellow-labeled vehicles (the government put labels on vehicles that don’t meet exhaust emission standards) and elimination policy, exhaust limitation, and oil reformation for old vehicles.
Exhaust emissions
The exhaust of sulphur dioxide (SO2), nitrogen oxides (NOx), and soot from industries and households were extracted from Jinan Statistical Yearbook26.
Air pollution data
Daily mean air pollutant concentration data of inhalable PM2.5, PM10, SO2, NO2 and CO, and daily maximum of 8-hourly running mean of O3 were obtained from Jinan Environmental Monitoring Center from January 1, 2013 to December 31, 2017. The data of 2013–2015 were obtained from 15 fixed air monitoring stations, and data of 2016–2017 were obtained from 32 fixed air monitoring stations (Fig. 2). The annual average concentration of air pollutants in city and districts were calculated by the mean of air pollutants concentration in the fixed air monitoring stations. Before 2016, four districts (Shanghe, Jiyang, Zhangqiu, and Pingyin) had no air monitoring station. Therefore the annual average concentration of air pollutants in the four districts between 2013 and 2015 were calculated by the average of 15 fixed air monitoring stations.
Mortality and morbidity data
Four leading causes of mortality attributable to PM2.5 exposure, including ischemic heart disease (IHD), stroke, lung cancer (LC), and chronic obstructive pulmonary disease (COPD), recommended by Global Burden of Disease (GBD) study were included3. We obtained the four cause-specific mortalities (age > 25 years) of Jinan between 2013 and 2017 from Jinan Municipal Center for Disease Control and Prevention, which is responsible for death surveillance.
We selected five PM2.5-related health endpoints of morbidity, including respiratory disease hospital admission (RHA), cardiovascular disease hospital admission (CHA), chronic bronchitis (CB), asthma attack (AA), and respiratory disease emergency room visits (REV). Because of limited local data for the cause-specific morbidities, we used the national cause-specific morbidity rate of RHA, CHA, CB, AA, and REV as the reference morbidity in our estimation, which were collected from China Statistical Yearbook36.
Estimation of health effect
We firstly estimated the long-term burden of mortality and morbidity attributable to PM2.5 in Jinan in 2013 and 2017, and then calculated the reduction in mortality and morbidity between 2013 and 2017.
Hazard ratios of mortality
The Global Exposure Mortality Model (GEMM) constructed by Burnett et al. 201837 was used to examine the long-term mortality effects between 2013 and 2017. GEMM modeled the hazard ratio association between outdoor PM2.5 and non-accidental mortality using data from 41 cohorts of 16 countries, including the Chinese Male Cohort. GEMM for each of the five specific causes of GEMM 5-COD was used to estimate the combined population-attributable fraction based on five specific causes of death (age > 25 years) examined by the GBD. In our study, we estimated the IHD, stroke, LC, and COPD in 2013 and 2017. The GEMM through the Log-Linear (LL) model was used to estimate excess deaths from exposure to ambient PM2.5, the formula is shown as (1):
$$H{R}_{{rm{mortality}}}=exp{theta f(z)omega (z)}$$
(1)
where f(z) = z or f(z) = log(z + 1), HR morbidity = 1 when z = 0 for either form of f. Where, ω(z) = 1/(1 + exp{−(z−µ)/(τr)}) is a logistic weighting function of z and two parameters (µ, τ) with r the range in the pollutant concentrations. The parameter τ controls the amount of curvature in ω with μ controlling the shape. The set of values of ((f, µ, τ) define a shape of the mortality–PM2.5 association. The estimation method is based on a routine that selects multiple values of (f, µ, τ) and given these values, estimates of θ and its standard error are obtained using standard computer software that fit the Cox proportional hazards model.
Relative risk of morbidity
We used the Log-linear function to estimate the long-term morbidity attributable to PM2.5 in 2013 and 2017. This function has been applied for several studies in China15,38. The cause-specific morbidity relative risk (RR morbidity) was calculated using the following Eq. (2):
$$R{R}_{{rm{morbidity}}}=exp ,[beta times (C-{C}_{0})]$$
(2)
where β is the exposure-response coefficients, which means the cause-specific morbidity changes per 1 μg/m3 of PM2.5 increase; C is the annual concentration of PM2.5 (μg/m3) and C0 is the reference concentration. We used the reference concentration of PM2.5 10 μg/m3 as the morbidity estimation to perform the long-term morbidity assessment, as used in previous studies15,38. The β coefficient for cause-specific morbidity could be derived from RR, using the following Eq. (3):
$$beta =,mathrm{ln}(RR)/Delta C$$
(3)
where RR can be obtained from the recent epidemiological studies in China; ΔC is the change in PM2.5 concentration. For example, PM2.5 per 10 μg/m3 increase, the RR for RHA was 1.022 (95% CI: 1.013–1.032)39, the RR of CHA was 1.013 (95% CI: 1.007–1.019)40, the RR of CB was 1.029 (95% CI: 1.014–1.044)39, the RR of AA was 1.021 (95% CI: 1.015–1.028)41, and the RR of REV was 1.010 (95% CI: 1.005–1.016)5, respectively.
Estimation of health benefits
The health benefits from reduced cause-specific mortality and morbidity were calculated by the difference in health impacts (HI) between 2017 and 2013. HI was calculated from HRmortality and RRmorbidity for cause-specific disease in 2013 and 2017 using Eq. (4). This function has been applied in previous studies15.
$$HI=[(RR-1)/RR]times Ptimes Pop$$
(4)
where HI is the health impacts of cause-specific disease; RR is the HRmortality or RRmorbidity of cause-specific disease; P is the cause-specific mortality or cause-specific morbidity; Pop is the population exposed to ambient PM2.5.
Estimation of economic benefits
The associated economic benefits of cause-specific mortality and morbidity were further quantified. The methods used to estimate health economic costs (GDP per capital) of PM2.5-related mortality and morbidity in our study followed methodologies in a previously published study15, which was based on the willingness to pay (WTP) and cost of illness (COI) methods. The WTP method could be used in calculating the individual willingness to pay for a small reduction of mortality risk and estimating morbidity related economic costs6,15,42. The COI method calculated the disease costs in terms of medical treatment, hospitalization, and productivity loss42. The health costs for Jinan in 2016 was used and adjusted using GDP per capita from the health costs for Shandong Province in 201615. The health costs (per capita) for Jinan and Shandong Province in 2016 are shown in Table S2.
Lastly, we calculated the total health costs of cause-specific mortality and morbidity in 2013 and 2017 by multiplying the cause-specific HI with health costs. The health-related economic benefit was estimated by health costs in 2017 minus that in 2013. The total economic benefit was calculated by adding the benefits from cause-specific mortality and morbidity.
We further projected the co-benefits in health and economics under a future scenario of PM2.5 annual concentration reduced from 2013 (110 ug/m3) to the national ambient air quality standards Grade-II (15 ug/m3)25.
All statistical analyses for this study were performed using R software (version 3.2.2, https://mirrors.tuna.tsinghua.edu.cn/CRAN/). Map was created by the packages of mapdata (https://cran.r-project.org/web/packages/mapdata/index.html), maps (https://cran.r-project.org/web/packages/maps/index.html) and ggmap (https://cran.r-project.org/web/packages/ggmap/).
Source: Ecology - nature.com
