Aridity index
AI, a measure of climatic dryness, is the ratio of the annual precipitation (P) to annual PET. Drylands are defined as regions where the AI is less than 0.65, and humid regions are defined as the regions where the AI is greater than 0.65. We used previously published global AI datasets with a spatial resolution of 0.5° × 0.5° from 2000 to 2100 (ref. 19). Previous comparisons demonstrated strong agreement between CMIP5 historical simulations for 1948–2005 and observations of dryland variability19.
MODIS GPP data
GPP is the capacity of vegetation to capture carbon and energy during the process of photosynthesis42. We used monthly MODIS global terrestrial GPP products from 2000 to 2014 with a spatial resolution of 0.5° × 0.5° (ref. 23). The MODIS17 is the first continuous satellite-driven dataset monitoring global vegetation productivity. The fundamentals for the MOD17 algorithm are to apply radiation conversion efficiency in predicting daily GPP. Specifically, the MODIS GPP is estimated using a light use efficiency (LUE) model developed by Monteith42, in which gross photosynthesis is proportional to the amount of the absorbed photosynthetically active radiation (PAR) by plants. The LUE model is rewritten as43,44
$${mathrm{GPP}} = varepsilon _{mathrm{max}} times 0.45 times {mathrm{SW}}_{{mathrm{rad}}} times f{mathrm{PAR}} times f{mathrm{VPD}} times {{fT}}_{{mathrm{min}}},$$
(1)
where εmax is the maximum LUE, SWrad is the downward solar radiation, of which 45% is PAR, fPAR is the fraction of PAR being absorbed by plants, and fVPD and fTmin are the reduction scalars from water stresses (high daily VPD) and low daily minimum temperature. Varying climate conditions and diverse plant functional types pose difficulties in accessing the uncertain of MODIS GPP data. One primary uncertainty source is due to lack of accurate definition of (varepsilon), especially for complex and diverse ecosystems for which the same (varepsilon) could induce large uncertainties in estimating GPP. GPP can be overestimated for ecosystems with low productivity and underestimated for ecosystems with high productivity45. In arid and semiarid regions, accounting for the effect of soil moisture in the algorithm may reduce the uncertainty in GPP over drylands46. In addition, such LUE model has known issues in modeling fluxes in dry sites, particularly when soil moisture and VPD are decoupled and VPD is not a good indicator of water availability and water stress. Nevertheless, the MODIS GPP product remains the most widely used global GPP product with its advantage of continuously spatial and temporal coverage47.
MODIS products (Levels 1, 2, 3, and 4) are a new type of integerized sinusoidal projection data. We used MODIS Re-projection Tools to convert the MODIS GPP data formats and map projections to the WGS84/geographic system48. The global GPP datasets from 2000 to 2014 were used in this study.
FLUXNET GPP data
We compared the MODIS-derived GPP with the FLUXNET GPP. The FLUXNET GPPs are based on eddy flux measurements and have been widely used to validate MODIS GPP49. FLUXNET has established over 800 long-term eddy covariance flux tower sites, ranging from 30°S to 70°N, covering a wide range of climatic zones and terrestrial ecosystems (http://www.fluxnet.ornl.gov/). FLUXNET employs standard data quality assurance and control, and postfield data processing procedures to ensure high quality flux datasets with significantly reduced uncertainties associated with site-to-site variations in fluxes. The FLUXNET GPPs are obtained from the difference between measured net ecosystem exchange and calculated ecosystem respiration (Reco)45
$${mathrm{GPP}} = {mathrm{NEE}} – {mathrm{Reco}},$$
(2)
where the partitioning for Reco uses the nighttime method49,50.
In this study, we compared MODIS-derived GPP with flux-derived GPP from 13 FLUXNET flux sites across five different biomes across the global (e.g., SAV, GRA, WSA, CRO, and OSH). The flux data covered the years after 2000, available from 1 to 14 years for the selected sites (Table S2) after passing FLUXNET quality control. The results show that the MODIS GPP is well correlated with FLUXNET GPP (Supplementary Fig. 12; Supplementary Table 8). Our comparisons confirm the quality of MODIS datasets for studying temporal and spatial variations of the dryland GPP.
FLUXCOM GPP data
We also compared the spatial variations in the annual global dryland GPP from the MODIS datasets with those from the FLUXCOM datasets (Supplementary Figs. 13 and 14; Supplementary Table 9). The FLUXCOM GPP datasets (http://www.fluxcom.org/) are derived with upscaling approaches based on three machine learning algorithms that integrate 224 FLUXNET site level observations, satellite remote sensing, and meteorological data. The use of three machine learning algorithms minimizes sources of uncertainty in empirical upscaling and ultimately provides an ensemble of machine learning-based global flux products to the scientific community for evaluating process-based land-surface models [http://www.fluxcom.org/]51. Briefly, the machine learning algorithms were initially trained to site-level observations of the explanatory climate and land-surface variables. To capture variabilities in vegetation greenness and land-surface temperature with reliable input of changes associated with soil moisture, the variables from high-resolution satellite remote sensing data were fed into the extensive variable selection analysis52. The machine learning algorithms and their training and a thorough cross-validation of the data are presented in Tramontana et al.53. To obtain the global GPP, the trained and validated machine learning algorithms were driven by with global gridded satellite data of selected explanatory variables, at 10 km spatial and 8 days temporal resolutions for the period 2000–2014. Due to the complex topography and ecosystem functions, large uncertainties remain in obtaining spatial and temporal patterns of GPP on regional and global scales from FLUXNET GPP using different upscaling methods54,55. Since the 224 flux sites are not uniformly distributed over the globe with different climate types and plant function types, and there are less dense flux sites over drylands, caution should be also taken when explaining CO2 dynamics over drylands.
CMIP5 GPP data
We also compared the MODIS-derived GPP with the simulated GPP from 15 CMIP5 models. The CMIP5 simulations include long-term (century timescale) integrations and near-term integrations (10–30 years) or decadal prediction experiments25. The CMIP5 GPP datasets can be downloaded at https://esgf-node.llnl.gov/search/esgf-llnl/. We compared our GPP with the ensemble means of the GPP from 2010 to 2100 simulated by the 15 CMIP5 models (Supplementary Table 8). The multimodel ensemble, which is different from the ensemble of simulations produced by individual models, represents a variety of best-effort attempts to simulate the climate system. To the extent that these attempts are at least somewhat independent and that the collection of models is not systematically biased on the whole, the ensemble can be used to provide both a consensus representation of the climate system and, based on the spread of model results, provide some measure of how much confidence might be placed in that consensus.
Meteorological data
The precipitation dataset from the National Center for Environmental Prediction’s (NCEP) Climate Prediction Center is an observation-based dataset with a global latitude-longitude resolution of 0.5° × 0.5° (ref. 56), which can be downloaded at http://www.cpc.ncep.noaa.gov/. Air temperature, VPD, and wind speed (WS) are obtained from the NCEP/National Center for Atmospheric Research reanalysis57, which can be downloaded at https://www.esrl.noaa.gov/psd/data/gridded/reanalysis/. The soil moisture data used here are the monthly GLDAS version 2 product (GLDAS-2) during the period from 2000 to 2014, with a horizontal resolution of 1° × 1° (ref. 58), which can be accessed at https://disc.gsfc.nasa.gov/datasets?keywords=GLDAS. PET is estimated using the Penman–Monteith algorithm, which is driven by meteorological parameters including net radiation, soil heat flux, mean daily air temperature, WS, saturation vapor pressure, and vapor pressure21. These meteorological data from 2000 to 2014 are used to analyze their influence on GPP.
Statistical analysis
To show the accuracy of MODIS product, we computed the correlation coefficients using the ordinary least square (OLS) regression and the root mean squared error (RMSE) between the two GPP products,
$${mathrm{RMSE = }}sqrt {frac{{mathop {sum }nolimits_{t = 1}^n left( {{mathrm{GPP}}_{{mathrm{flux}}} – {mathrm{GPP}}_{{mathrm{MODIS}}}} right)^2}}{n}} ,$$
(3)
where GPPflux and GPPMODIS are the FLUXNET-derived and MODIS-derived GPP, respectively. The linear trend of GPP was estimated using the OLS regression, and the significance level of the linear correlation was calculated with a two-tailed test. The IAV of GPP was computed as the mean absolute global GPP anomaly.
Method to calculate relative contributions
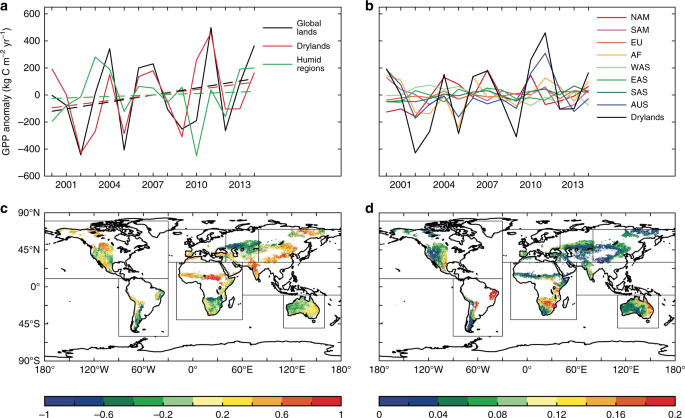
The relative contributions of the individual GPP trend from each of the eight regions to the global dryland GPP trend were calculated such that the overall trend equals the sum of the trend for each of the eight regions. To calculate the relative contributions of the GPP IAV from each of the eight regions to the global dryland GPP IAV, we adopted an index used in a previous study10
$$f_i = mathop {sum }limits_t frac{{x_{it}left| {X_t} right|}}{{X_t}}/mathop {sum }limits_t left| {X_t} right|,$$
(4)
where xit is the GPP anomaly for region i at time t in years, and Xt is the global dryland GPP anomaly, so that (X_t = {mathrm{Sigma }}_tx_{jt}). The fi is the average relative anomaly (x_{it}/X_t) for region i, and this definition should guarantee that ({mathrm{Sigma }}_if_i = 1). The resulting scores for a region fi represent its contribution to global dryland variations. Regions with high scores contribute strongly to overall dryland GPP variations, while regions with low scores contribute less. Regions with negative scores dampen variations.
Source: Ecology - nature.com

