Determining the most abundant species based on gene expression
During three consecutive years, an in situ survey (Fig. 1; Supplementary Table S1) of A. minutum blooms was performed in the Bay of Brest (France), resulting in 41 meta-transcriptomic datasets (a total of 16.108 reads). The environmental reads were aligned to a meta-reference (MetaRef2; see methods) composed of the reference transcriptomes of 219 different species. A total of 12 species displayed a maximum Relative Abundance of Transcripts (RAT; see methods) higher than 0.03 and were specifically analyzed. Out of these 12 species, there were six large diatoms (Chaetoceros curvisetus, C. cf. neogracile, Helicotheca tamesis, Leptocylindrus aporus, Skeletonema dorhnii, and Thalassiosira punctigera), three dinoflagellates (A. minutum, Gonyaulax spinifera, Prorocentrum micans), two small (<2 µm) chlorophytes (Micromonas pusilla, and Ostreococcus lucimarinus) and one apicomplexan parasite of free-swimming tunicates (Lankesteria abbotti). For these 12 species, the total number of reads ranged from 17.105 to 29.107, representing between 1‰ and 17.4% of the analyzed reads for P. micans and A. minutum, respectively (Supplementary Table S2). The reads aligning to the 12 species added up to a total of 41.107 reads, representing 25% of the environmental reads. The RAT of the 12 species was highly dynamics across time points (Fig. 2a). Without surprise, the transcripts of A. minutum, were especially abundant with 31 sampling times displaying a RAT > 0.02 and a maximum RAT = 0.33. Although RAT maybe taken as an estimation of the relative abundance of a species in the community, it was related to the absolute A. minutum cell densities in the samples (Spearman’s Rho= 0.60; Supplementary Fig. 1a). Three species often displayed a RAT > 0.02 and often reached RAT > 0.1. This was the case for C. curvisetus (14 samples with a RAT > 0.02, max RAT = 0.29) and C. cf. neogracile (9 samples with a RAT > 0.02, max RAT = 0.1), as well as P. micans (11 samples with a RAT > 0.02, max RAT = 0.1). Two species, L. aporus (3 samples with a RAT > 0.02, max RAT = 0.15) and M. pusilla (3 samples with a RAT > 0.02, max RAT = 0.18) very punctually displayed high RAT. Three others, H. tamesis (7 samples with a RAT > 0.02, max RAT = 0.07), O. lucimarinus (6 samples with a RAT > 0.02, max RAT = 0.05), and L. abbotti (10 samples with a RAT > 0.02, max RAT = 0.07) often displayed RAT > 0.02, but never reached high RAT. Finally, the last three species considered, S. dorhnii (3 samples with a RAT > 0.02, max RAT = 0.05), T. punctigera (2 samples with a RAT > 0.02, max RAT = 0.04), and G. spinifera (4 samples with a RAT > 0.02, max RAT = 0.08) displayed a RAT > 0.02 in a few samples and never reached high RAT.
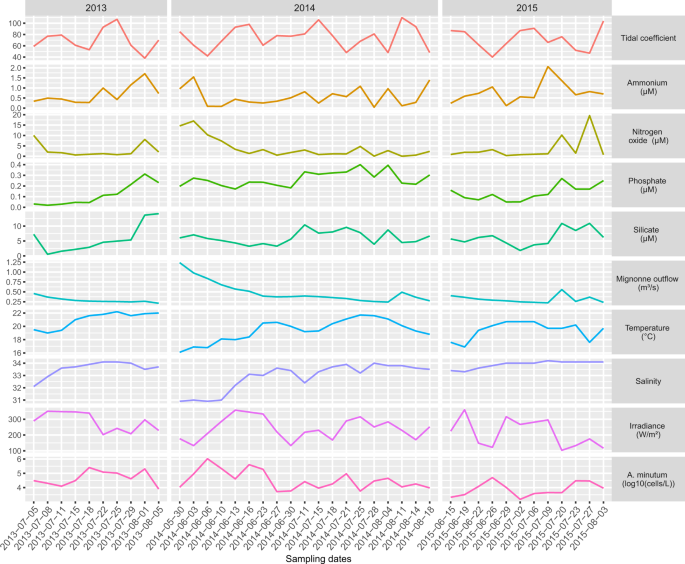
Environmental parameters. For each sampling date, values of nine abiotic environmental parameters and A. minutum cell densities.
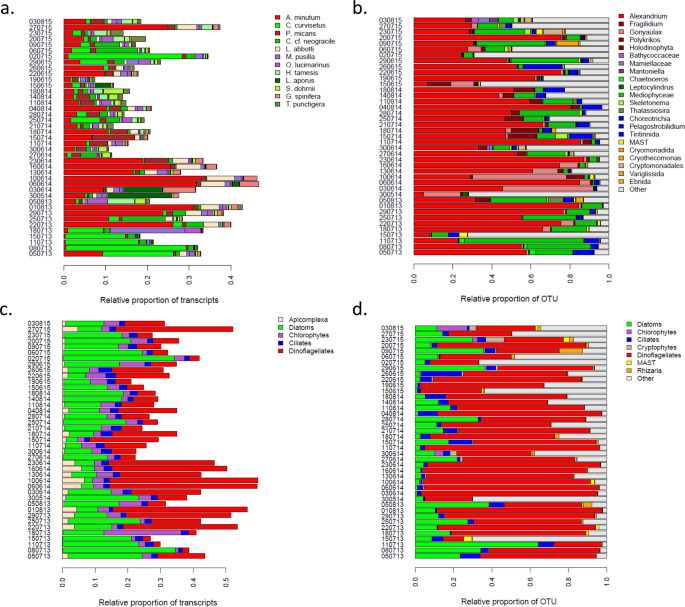
Relative abundances of the members of the sampled communities for each sampled time point. Panels a. and c. indicate the relative abundance of transcripts (RAT, see methods) for each a. species, and b. phylum. Panels b. and d. indicate the relative abundance of OTU based on metabarcoding data for each b. genera, and c. phylum.
Performing the RAT analysis at the scale of the major phylum clearly indicated that the aligned reads mainly belonged to diatoms and dinoflagellates in variable proportions and to a lesser extent to ciliates, chlorophytes, and Apicomplexa (Fig. 2c). The 12 species explained a very large proportion of the RAT observed at the phylum level, suggesting that the expression dynamics at the phylum level was mainly due to a few abundant species rather than to a multitude of rare species.
Comparison with metabarcoding
In parallel to the meta-transcriptomic approach, the composition of the micro-eukaryote community was characterized using a metabarcoding approach (Fig. 2b and d). When comparing the two datasets, the same genus were often identified with the two approaches. This was indeed the case within dinoflagellates for the genus Alexandrium, but also Gonyaulax, and within the diatoms for the genus Chaetoceros, Leptocylindrus, Skeletonema, Thalassiosira. Some of the results that might, at first sight, appear as not entirely compatible among the two datasets probably simply reflected a difference in taxonomic resolution of the meta-transcriptomic and meta-barcoding approaches. For instance, P. micans and Chaetoceros in the meta-transcriptomic dataset might correspond to the Holodinophyta and Mediophyceae OTUs in the meta-barcoding dataset, respectively. A major difference between the two datasets was the amount of relative abundance of transcripts and of OTU captured by the two datasets. While the 12 species corresponded on average to a RAT of 0.24 across samples (considering the raw data instead of the normalized proportion, the average proportion of aligned reads was 0.43), the average relative proportion of OTU that could be attributed to micro-eukaryote was 0.78 (the category Other corresponding to a mix of metazoan, land plant, unresolved eukaryotes and unassigned reads). This difference was mainly explained by the same species representing a very different relative abundance of transcripts and OTU. This was extremely clear for Alexandrium, representing an average RAT of 0.09 (average proportion of aligned reads of 0.17) while displaying an average relative proportion of OTU of 0.50. There was a better correlation between RAT and A. minutum cellular densities (Spearman’s Rho = 0.60; Supplementary Fig. 1a), than between A. minutum RAT and A. minutum relative OTU abundances (Spearman’s Rho = 0.48; Supplementary Fig. 1b), or between A. minutum relative OTU abundances and A. minutum cellular densities (Spearman’s Rho = 0.50; Supplementary Fig. 1c).
Another important difference was highlighted when considering the phylum level. While in term of expression, the average of the ratio between RAT of dinoflagellates and diatoms was 1.1 (2.4 considering raw reads), when considering the metabarcoding data, the average of the ratio rose to 4.2, indicating that in the same community rRNA/mRNA ratio might be four times higher for Dinoflagellates compared to Diatoms.
Gene expression dynamics in situ
A total of seven modules regrouping between 3,864 and 34,944 transcripts displaying similar expression dynamics across samples were identified (Fig. 3a). The expression dynamics of these modules across samples ranged from relatively stable (Modules ME3, ME5, ME7) to highly dynamics (ME2, ME4). The eigengenes of four modules had a slightly correlated expression dynamics (ME1, ME2, ME4, ME6) while the three others appeared completely independent (ME3, ME5, ME7) (Fig. 3b). More specifically, the transcripts belonging to ME1 tend to display high expression at the beginning of the 2013 bloom and then around the middle of the 2015 bloom. The transcripts belonging to ME2 were less expressed during 2013 and at the beginning of the 2014 bloom and more expressed at the end of the 2014 bloom and during 2015. The ME3 transcripts were slightly more expressed during 2013 and 2015 than during 2014. The ME4 transcripts displayed fluctuating expression during each of the three years. The ME5 transcripts displayed a very low level of expression at a single sampling date (July 11th 2013). ME6 transcripts were more expressed at the beginning of 2014 and 2015. Finally, ME7 transcripts were less expressed during 2015.
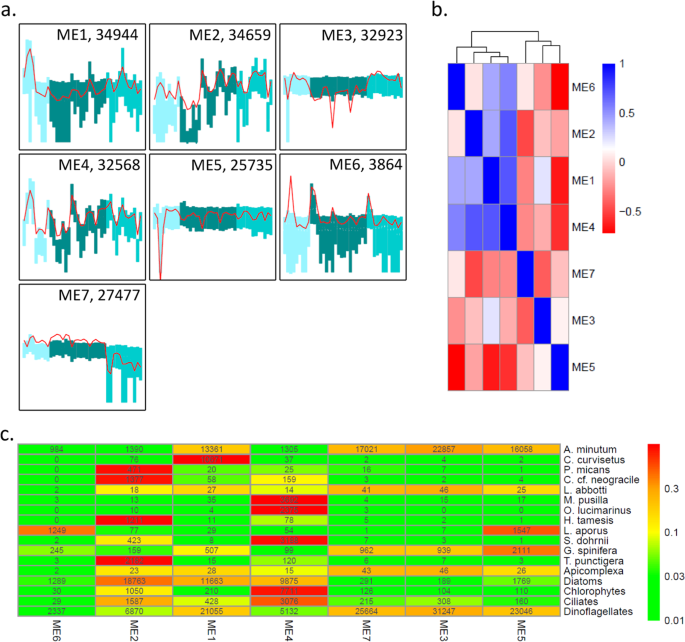
Modules of transcripts displaying similar expression dynamics across samples. a. the 7 identified expression modules. The 40 samples are on the x-axis, the shade of the bars represent the three years (2013, 2014, 2015). The y-axis indicates the level of expression (vst transformed raw-counts, range (−7,12)), the red lines indicate the expression dynamics of the eigengenes, the bars range from the first to the third quartile of the expression levels. The number of transcripts belonging to each module is indicated, b. Heatmap representing the Pearson correlation coefficient among the 7 expression modules. c. Heatmap indicating how the transcripts of 12 species as well as of the main phylum are distributed in the 7 expression modules. The color scale is based on the proportion of transcripts from each species/phylum assigned to each module. Numbers indicate the number of transcripts in each module.
The distribution of the transcripts of the 12 species in the seven modules was highly heterogeneous, and was of course strongly linked to the RAT dynamics described above (Fig. 3c). Five of the modules were to great extent composed of transcripts belonging to the 12 species (>64% of the transcripts of ME1, ME3, ME5, ME6, ME7); while in the two remaining modules their proportion was considerably lower (21% and 34% of ME2, and ME4). Eight of the species of interest had more than 85% of their transcripts in a single module. This was the case of C. curvisetus (99% of the transcripts in ME1), P. micans (87% of the transcripts in ME2), C. cf neogracile (86% of the transcripts in ME2), M. pusilla (98% of the transcripts in ME4), O. lucimarinus (99% of the transcripts in ME4), H. tamesis (93% of the transcripts in ME2), S. dohrnii (88% of the transcripts in ME4), and T. punctigera (93% of the transcripts in ME2). For three species, a non-negligible proportion of transcripts were found in more than one module. This was the case of A. minutum displaying more than 900 transcripts in each of the seven modules and more than 20% of its transcripts in each of four modules (ME1, ME3, ME5, ME7). Transcripts from ME1, ME2 and ME4 were less expressed when A. minutum cells were abundant, while there was a tendency of transcripts from ME7 to be more expressed when A. minutum cells were abundant. The level of expression of transcripts from ME3, ME5 and ME6 was not related to A. minutum cell densities (Supplementary Fig. 2).
Two other species displayed numerous transcripts in several modules: L. aporus displayed 42% and 52% of its transcripts in ME5, and ME6 and G. spinifera had more than 18% of its transcripts in each of four modules (ME1, ME3, ME5, ME7). The last species, L. abbotti displayed very few transcripts in all the modules and was not further analyzed.
Focusing on the transcripts at the phylum level (Fig. 3c), we note that three modules were mainly composed of transcripts from dinoflagellates and diatoms (ME1, ME2, ME6) in mixed proportions. One module was composed of transcripts from diatoms and dinoflagellates but also from chlorophytes and ciliates (ME4). The last three modules were mostly composed of transcripts from dinoflagellates (ME5, ME3, ME7;>89% of the transcripts). As stated above, two modules (ME2, ME4) were composed of transcripts not belonging to the 12 species specifically analyzed. In ME2, more than 40% of the transcripts aligned to other diatoms reference transcriptomes. In ME4, the transcripts mostly corresponded to other diatoms (20%), dinoflagellates (11%), but also ciliates (10%).
Relationships between gene expression dynamics and environmental factors
A set of abiotic factors was used to characterize the abiotic environment encountered by the sampled micro-eukaryote communities (Fig. 1). The expression dynamics of the seven modules were correlated with these abiotic factors as well as with absolute A. minutum cell densities and with the RAT (taken as an indicator of the relative abundance of the species/phylum within the community). Focusing on A. minutum, absolute cell densities were higher when nitrogen oxide (nitrate, nitrite) and phosphorous displayed higher concentrations (Fig. 4). As already noted above, A. minutum transcripts were especially abundant in four modules. Interestingly, ME1 regrouped transcripts more expressed when absolute and relative A. minutum abundances tend to be low in nutrient poor environmental conditions and when Diatoms tend to be relatively abundant. Transcripts in ME3 and ME7 tend to display high expression in contrasting environmental conditions with high salinity and high river flow, respectively. Finally, ME5 transcripts tend to be more expressed when Diatoms were relatively rare.
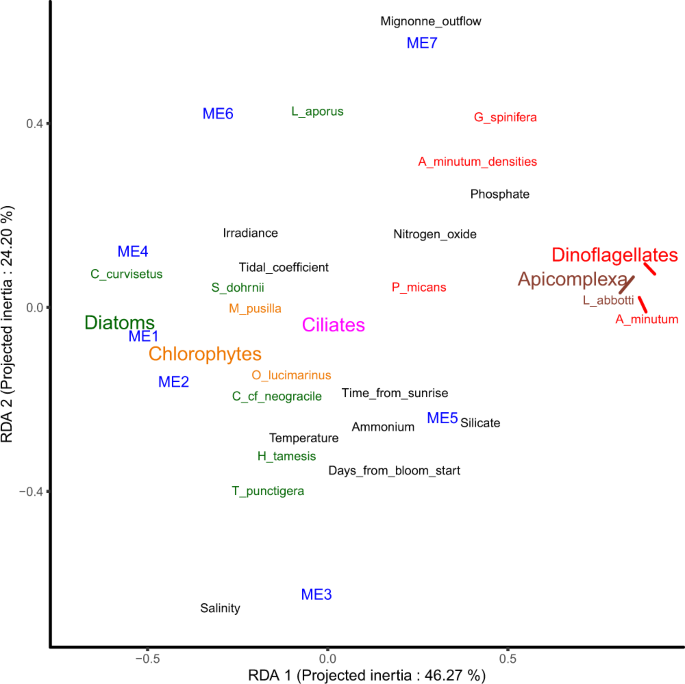
Representation of the two first axis of the RDA led between the gene expression modules and environmental factors. The eigengene of the expression modules (ME1 to 7) are plotted with the contribution of 11 explicative abiotic environmental variables (in black), of A. minutum cell densities and of the relative abundance of transcripts (RAT) of diatoms (green), dinoflagellates (red), chlorophytes (orange), ciliates (pink), and Apicomplexa (brown).
More generally, and as already suggested by the analyses presented above, a large portion of the expression variance was linked to fluctuation of relative abundance of the species composing the community (Fig. 4). The first axis strongly separated the expression modules highly expressed in a nutrient rich (phosphate, nitrogen oxide, silicate) environment with a high relative abundance of dinoflagellates (ME5, ME7, Fig. 4) and in a nutrient poor environment with high relative abundance of diatoms (ME1, ME2, ME4, Fig. 4). The second axis mainly separated modules displaying dynamic expression levels in relation with river outflow and associated salinity fluctuations.
Functions of the transcripts displaying dynamic expression
The functions of the transcripts grouped into expression modules were investigated at the species level (see Material and Methods for details; Fig. 5). A total of 76 Gene Ontology (GO) biological processes were identified as displaying a species specific transcript enrichment in at least one expression module.
- 1.
Alexandrium minutum displays strong species specific functional enrichment
Overall, compared to the other species considered, A. minutum displayed a strong depletion of transcripts related to photosynthesis, carbon fixation, reductive pentose-phosphate cycle and gluconeogenesis. This contrasting pattern was also visible in specific expression modules. For instance, in ME3, photosynthesis related transcripts were over-represented in G. spinifera but under-represented in A. minutum. Similarly, in ME1, photosynthesis related transcripts were over-represented in C. curvisetus but under-represented in A. minutum.
Alexandrium minutum also displayed a contrasting over-representation pattern across expression modules. In ME1, corresponding to transcripts more expressed when the community was dominated by Diatoms and A. minutum was less abundant, numerous ion transport related functions were over-represented. These same functions were strongly under-represented in ME3, corresponding to transcripts more expressed when A. minutum was more abundant in an environment characterized by high river flow.
- 2.
For the other members of the community, the transcripts belonging to different expression modules were related to different biological processes.
Two other species displayed numerous transcripts in different expression modules. This was the case of L. aporus in ME5 and ME6. Of special interest was the over-representation of transcripts involved in photosynthesis, TCA cycle, as well as glycolysis/pentose phosphate shunt in ME5, while transcripts involved in digestion/protein catabolism were over-represented in ME6 (transcripts involved in photosynthesis were also over-represented in ME6, but to a lesser extent). The Dinoflagellate G. spinifera displayed slight differences among over-represented functions across four expression modules. We may for instance note the over-representation of photosynthesis related functions in ME3, 5, and 7, but not in ME1.
- 3.
Within a given expression module, the transcripts belonging to different species sometimes corresponded to the same biological processes
In ME1, A. minutum and C. curvicetus displayed over-representation of sterol/steroid biosynthesis transcripts. In ME2, three Diatoms (H. tamesis, T. punctigera, C. cf. neogracile) displayed extremely similar patterns, with high expression of photosynthesis, but also glycolysis, and fatty acid biosynthesis. In ME4, two chlorophytes (O. lucimarinus, and M. pusilla) and a Diatom (S. dohrnii) species displayed a partially similar pattern, with over-representation of photosynthesis, glycolysis, and pentose-phosphate related transcripts in the three species.
- 4.
Species belonging to the same phylum did not necessarily display similar biological process over-representation patterns
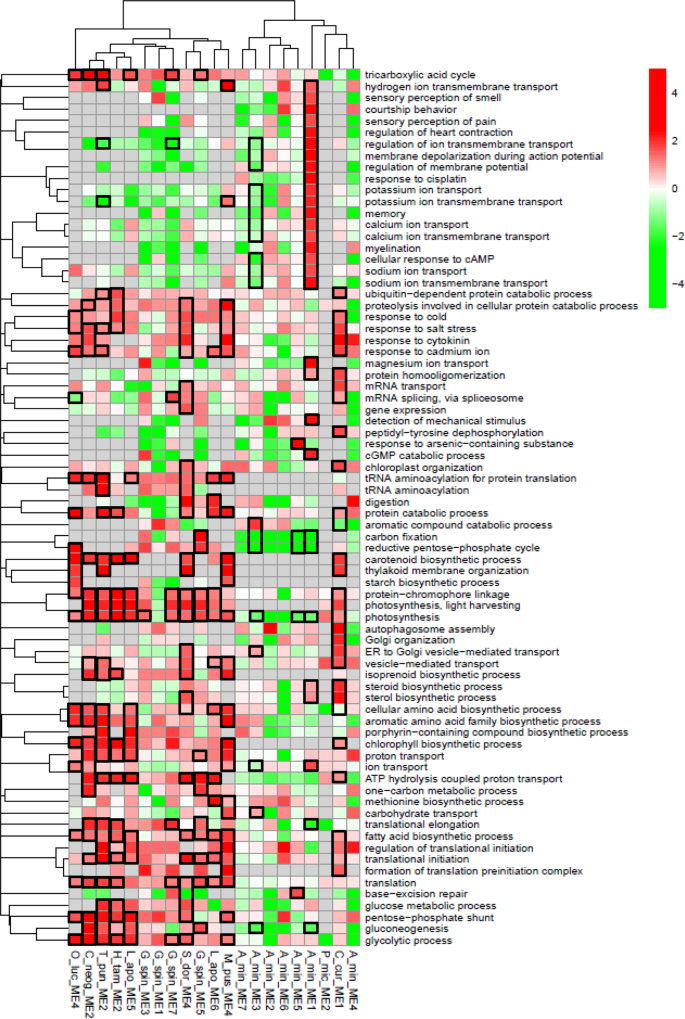
Over-representation of Biological Process GO terms in each species in each expression module. Heatmap colors indicate the odd-ratio for each GO term (GO displaying less than 20 transcripts were not analyzed and are in grey). GO terms were clustered based on overlap between GO (see Material and Methods for details). Black squares indicate q-values < 0.1.
The over-represented biological processes were compared among species belonging to the same phylum. The diatom species tend to display a constant over-representation of transcripts related to photosynthesis but also to a lesser extent to fatty acid biosynthesis. Other central biological processes, such as the ones related to the TCA cycle, glucose metabolism, glycolysis, gluconeogenesis, and pentose phosphate shunt displayed a contrasting pattern across species. The species C. curvisetus displayed an especially contrasting pattern, with over-representation of transcripts related to sterol/steroid metabolism, to autophagosome assembly and Golgi organization. The two chlorophytes displayed a similar pattern with over-representation of photosynthesis, glycolysis, and pentose-phosphate and starch biosynthesis related transcripts. Finally, as already suggested above, A. minutum displayed a contrasting over-representation pattern compared to the other two dinoflagellates.
Source: Ecology - nature.com


