Dates of first fungicide treatment
SSP survey
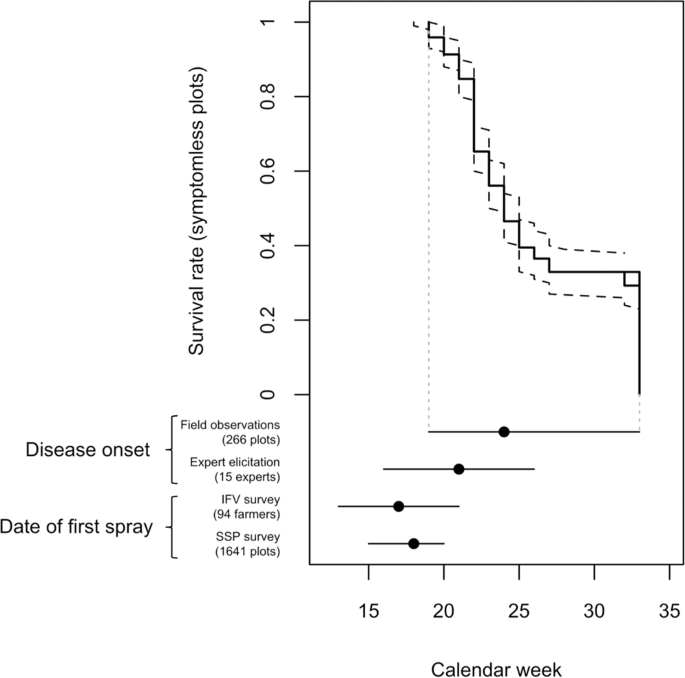
Pesticide use on vines in the Bordeaux region was surveyed by SSP during the 2010, 2013 and 2016 growing seasons, on 606, 576 and 459 vineyards (n = 1641), respectively. Information about product names, dates and rates of pesticide application were collected in each vineyard and the date of first fungicide application to control downy mildew was determined for all vineyard*year combinations.
Survey conducted by the French Vine and Wine Institute
In spring 2018, IFV published an online questionnaire to collect data from vine growers on the timing of the first anti-GDM treatment applied. Vine growers in the Bordeaux region (n = 94) were asked to report the frequency of treatments against GDM for each 10-day interval between March 1 and July 31. The protocol of the farm survey was approved by the IFV to ensure that the data source is valid and that the data is used correctly and ethically. The responses received were used to plot histograms and to determine likely dates of first treatment. A continuous probability distribution was fitted to each histogram with the fitdist() function of version 1.4.0 of the SHELF package50 of R51 (version 3.3). The distribution yielding the best quality of fit was selected for estimation of the median date of first GDM spray for each vine grower.
Dates of GDM onset
Survival analysis
Dates of GDM onset were estimated by analyzing epidemiological data collected from untreated plots in vineyards of the Bordeaux region. GDM incidence data were collected from 266 vineyards in the Bordeaux region from 2010 to 2017 by the technical staff of the IFV. In each vineyard, at least one untreated row of vine stocks was monitored for the detection of GDM symptoms. The number of vine stocks with GDM symptoms was determined by visual inspection. Visual observations stopped when the proportions of infected vine stocks and bunches were close to 100%. In total, 1 to 19 GDM incidence data were collected in each vineyard. Cox survival models52 were fitted to estimate the dates at which the epidemiological threshold of 1% of vines infected was reached in the sample of untreated vines surveyed. The results obtained with the fitted Cox model were used to derive three distributions of dates of GDM onset: a common distribution for all years, and two separate distributions for years characterized by dry spring (rainfall in March-May < 1.51 mm/day) and years with a wet spring (rainfall in March-May > 5.45 mm/day), respectively. 95% confidence intervals were computed from 1000 bootstrap samples. A full description of the statistical procedure is presented elsewhere22.
Expert probabilistic elicitation
Fifteen experts (technical advisors to vine growers) were individually asked to estimate the dates on which a threshold of 1% of vines displaying disease (i.e., GDM onset) would be reached in untreated plots in the Bordeaux region in 2017–2018. The experts were asked to assess the probability of the epidemiological threshold being reached for each 10-day interval between March 1 and July 31. Each participant gave a reply in the form of a histogram, according to the guidelines of the “roulette” method53. Several probability distributions were then automatically adjusted to fit each histogram and the distribution giving the best fit was selected. Each elicitation was carried out with MATCH Tool®53 and resulted histograms were analyzed using the fitdist() function of version 1.4.0 of the SHELF package50 of R51 (version 3.3). This procedure was applied by each expert, each year, between April 15 and May 15, generating one distribution of dates of GDM onset per expert*year combination.
Number of fungicide treatments
For each distribution of dates of first anti-GDM treatment or of disease onset dates, we calculated a mean number of fungicide sprays in vineyards of the Bordeaux region. Each distribution was used to compute the proportion of vineyards in which fungicide treatment begins for each week, between cw 12 (mid-late March) and cw 33 (mid August). These proportions were then multiplied by the duration of the treatment period (number of weeks) and by the treatment frequency.
Based on each probability distribution, the mean number of fungicide applications against GDM (NT) in the Bordeaux vineyards was calculated as
$$NT=mathop{sum }limits_{{t}_{i}={t}_{S}}^{{t}_{F}}{omega }_{{t}_{i}}({t}_{F}-{t}_{i})F$$
where ti is the week of the first treatment (based on the distributions of dates of first GDM application and disease onset, estimated as explained above), tF is the week of the last treatment, ({omega }_{{t}_{i}}) is the proportion of vineyards in which fungicide treatment begins on date ti, and F is the treatment frequency, in weeks. The values of ({omega }_{{t}_{i}}) were calculated from the probability distributions.
Computations derived from current practices in Bordeaux vineyards were made using a value of F based on local practices; according to national reports on fungicide use in French vineyards, vine growers apply fungicide every two weeks on average, i.e. (F=1/2)24. Some farmers may be tempted to increase the frequency of treatments if there is a delay in the date of the first anti-GDM spray. To estimate the impact of an increase in treatment frequency, two other values of F, F = 1 (one treatment per week) and F = 7/10 (one treatment every 10 days), were used to calculate the values of NT derived from the survival analysis and expert elicitation. It is unlikely that the frequency of treatment will exceed one per week, as the minimum persistence time for anti-GDM fungicides is at least seven days26.
Assessment of operator exposure to fungicides
AOEM model
The AOEM model is a statistical model developed by Großkopf et al.23 for the prediction of agricultural operator exposure in treatment scenarios representative of current agricultural practices in EU member states23. Operator exposure (in mg per kg of body weight per day) corresponds to the exposure of a professional operator during a whole working day spent mixing, loading and applying plant protection products. The exposure due to the rinsing of the containers or vessels and the cleaning and maintenance of the equipment is also taken into account.
Inhalation, head, ‘inner’ body (i.e. exposure of the body in the absence of special PPE use but with normal work clothes), ‘total’ body (i.e. sum of inner and outer body exposure), protected hand and unprotected hand exposure are modeled separately with log-linear equations in the form of (log (X)=alpha ,log (A)+sum [{F}_{i}]) where X is the exposure value (in mg per kg of body weight per day), A is the total amount of active substance used per operator per day and Fi is a set of categorical factors. The final form of the equation for each term depends on the pesticide mixing/loading and application scenarios considered.
Terms relating to dermal exposure (including the head, body and hand terms) and inhalation are used for the calculation of dermal exposure ((D{E}_{O})) and inhalation exposure ((I{E}_{O})) to an active substance, respectively. The assessment of (D{E}_{O}) and (I{E}_{O}) also takes into account absorption through the skin or by inhalation (according to the term assessed) of the active substance, the default body weight of the operator (i.e. 60 kilograms) and a risk mitigation factor corresponding to the use of PPE (if indicated). The model then estimates overall operator exposure (in mg per kg of body weight per day) as the sum of (D{E}_{O}) and (I{E}_{O}).
Based on new exposure datasets from 34 unpublished studies23, the AOEM model is representative of current agricultural practices, including PPE use, in EU member states12. Furthermore, the selection of these 34 studies was transparently explained, making the outputs of the model reproducible. EFSA considered this exposure model to be suitable for inclusion in its guidelines on operators’ exposure assessment and in its exposure calculator12. All calculations and model equations were included in the exposure calculator spreadsheet provided by EFSA12. This calculator is an electronic tool that uses the input provided to assess the exposure of operators, workers, residents and bystanders for each application scenario chosen12. The “Operator Outdoor Spray AOEM” section of this calculator (in which the AOEM model of Großkopf et al.23 is implemented) was used to assess operator exposure to the main active substances used to control GDM in the Bordeaux region according to different protection scenarios, as described below.
Main active substances used in Bordeaux vineyards against GDM
Use frequencies of the most common fungicides applied to control GDM in the Bordeaux region were calculated from the SSP surveys. Each fungicide product was characterized in terms of the mean number of sprays in a given vineyard and the number of vineyards in which it was used during each of the growing seasons surveyed (2010, 2013 and 2016).
The composition of each fungicide (i.e. names of active substances and amount of each molecule in the fungicide) was obtained from the ANSES E-Phy database54. Substances and fungicide products were paired, and the number of applications of each pair in the region was calculated by multiplying the mean number of treatments with the fungicide by the number of vineyards receiving these treatments.
The total number of treatments containing each active substance was calculated by summing the number of applications of the pairs containing the substance. The 13 most frequently used substances and substance*product combinations were selected (Table 1).
Operator protection scenarios
Operator exposure to each selected molecule was calculated for nine scenarios involving different combinations of PPE: i.e. gloves, face shield (referred to as a “visor” in the model options) worn with a hood, and anti-dust masks (FP2, P2 or similar type), during mixing, loading and application of the pesticide (Table 2). The closure of the tractor cabin door during pesticide application was simulated in three of these scenarios. A scenario with no PPE was also simulated. Each scenario was simulated for the 13 most frequently used substance*product combinations. In total, 126 simulations were performed in the “Operator Outdoor Spray AOEM” section of the EFSA calculator (Supplementary Table S1).
Exposure assessments were used to calculate the decrease in exposure resulting from the use of each item of PPE individually or in combination as (RE{D}_{i}=frac{({E}_{0}-{E}_{i})}{{E}_{0}}), with ({E}_{0}) operator exposure estimated for the scenario without PPE and ({E}_{i}) operator exposure estimated for the scenario involving the PPE or combination of PPE i.
Decreases in exposure due to the use of combinations of PPE were combined with those resulting from delaying the first fungicide treatment until disease onset, to assess the total reduction of exposure as (RE{D}_{ij}=1,(1-RE{D}_{i})(1-RE{D}_{j})), where (RE{D}_{i}) is the reduction resulting from using the ith combination of PPE, (RE{D}_{j}) is the reduction resulting from delaying the first anti-GDM treatment until the date of disease onset estimated with the jth estimation method (i.e. early or late expert probabilistic elicitation, null Cox model or Cox model including weather cofactors).
Source: Ecology - nature.com

