Oceanography and protist community composition
In summer 2012, the Arctic Ocean experienced an unprecedented decline in sea ice, resulting in a record sea ice minimum5. It has previously been shown that profound sea ice melt in summer 2012 led to increases in the light conditions and nutrient supply, affecting the microbial community and increasing net primary productivity of these waters5,25. Representative samples from across different Arctic oceanographic regions and encompassing multiple depths were sampled over a time span of three months, allowing us to compare a range of: communities, sea ice melt conditions, and temporal samples. For description of the oceanographic context of the samples please see Fig. 1, Table 1, Supplementary Fig. 1 and the methods section of this paper.
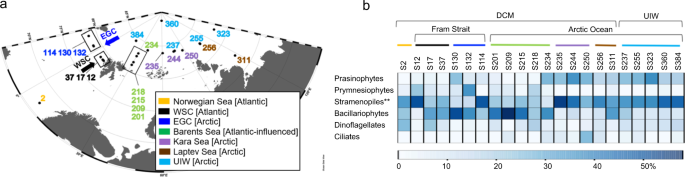
a Sampling locations on the expedition ARK-XXVII, cruise leg 2 and 3 onboard the RV Polarstern in summer 2012; East Greenland Current (EGC); West Spitsbergen Current (WSC)). b Major protist group distribution identified from V4 rDNA tag sequencing, shown as relative representation [%] at under-ice water (UIW) and deep chlorophyll max (DCM) sampling sites. **The ‘stramenopiles’ category shown excludes V4 sequences assigned as Bacillariophytes (Diatoms). See Supplementary Fig. 1 for more information on taxonomic composition of the V4 sequencing results.
To understand the wider community dynamic of the environments sampled, the microbial community structure was assessed using eukaryotic V4 SSU rDNA26 targeted PCR followed by high-throughput Illumina sequencing. The non-dimensional metric scaling (NMDS) ordination analysis comparing the ‘V4-identified’ community structure displayed differences in community diversity in the DCM samples (area shaded pink—Fig. 2a) compared to the UIW samples (area shaded grey—Fig. 2a). However, all UIW samples clustered within the DCM samples in the NMDS range, indicating no distinct community structure in UIW compared to DCM samples. Ice-free Atlantic water communities such as S2 (Norwegian Sea), S12–S37 (West Spitsbergen Current; WSC) and S201 (Barents Sea) grouped separately (on the ‘– side’ of the x-axis of the NMDS plot—Fig. 2a) from communities of the East Greenland Current (EGC; S114–S132) and other Arctic regions (ANOSIM: R = 0.67, p = 0.001). Single oceanographic regions showed some structuring effect, with samples originating from the same region (indicated by identical colour code—Fig. 2a) grouping closer to each other (ANOSIM: R = 0.35, p = 0.003). MANTEL tests of distance matrices demonstrated a correlation between environmental parameters and ‘V4-identified’ community structure. A subsequent principal component analysis for the purpose of identifying environmental factors which showed influence on community structure identified that the linked abiotic characteristics of temperature, salinity and sea ice concentration are significant factors (p ≤ 0.005) for driving the V4 eukaryotic community structure, consistent with other studies27,28,29,30,31.
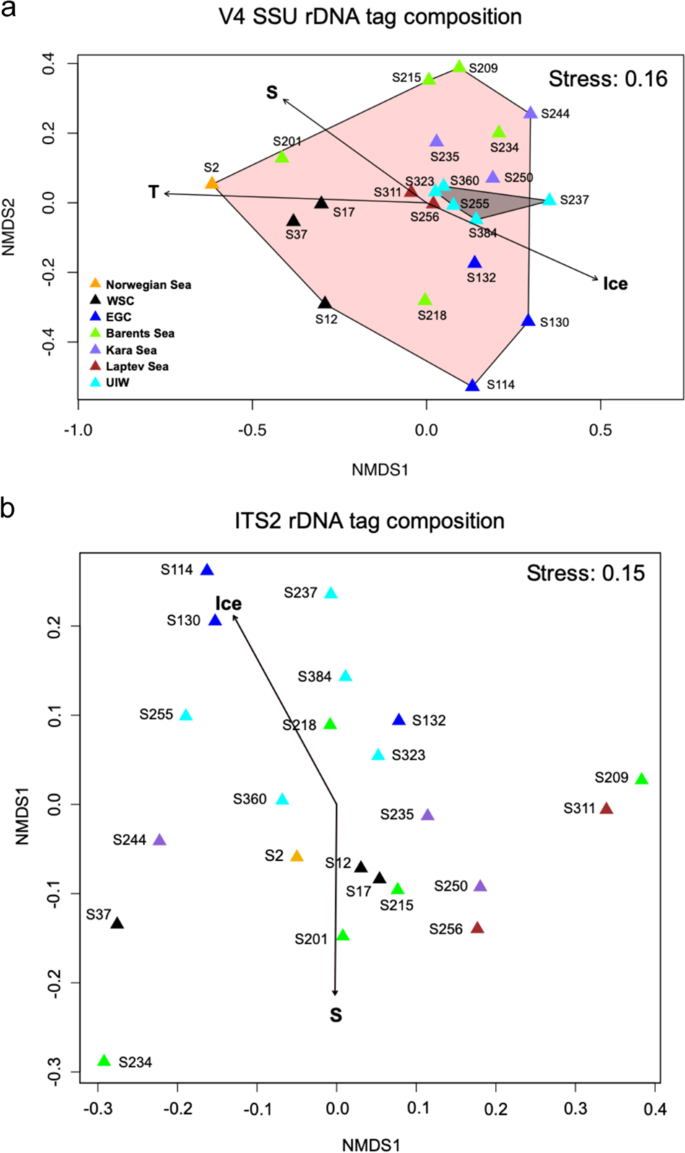
Two-dimensional nMDS plot of a the microbial eukaryotic community structure (derived from V4 tag sequencing) calculated with the Bray Curtis dissimilarity index (R = 0.16). Temperature (T), salinity (S) and sea ice concentration (Ice) affected the community structure significantly (p ≤ 0.001), framed areas indicate sampling provenance within the DCM (pink) or UIW (grey) b the fungal community structure (derived from ITS2 tag sequencing) calculated with the Bray Curtis dissimilarity index (R = 0.15) and with salinity and sea ice concentration shown to be major factors affecting the community structure (p ≤ 0.05).
The major eukaryotic phytoplankton groups were distributed as show in Fig. 1b and Supplementary Fig. 1, with prasinophytes (Chlorophyta) recovered at a higher relative representation in Arctic waters of the EGC (S114–S132) and a subset of Arctic sampling stations (specifically at S234–S384). Bacillariophytes (diatoms) showed a higher relative representation in the Fram Strait (EGC, e.g., S114–S130 and WSC, e.g., S17 & S37) and the Barents Sea (S201–S234). Other stramenopiles, mainly of MAST affiliation (e.g., MAST-6; Supplementary Fig. 1) showed increased relative representation in the Eastern Arctic Ocean waters (S235–S384). Specifically, within the DCM samples, the phytoplankton community structure also showed a strong differentiation in cell size between nanoplankton (2–20 µm, e.g., prymnesiophytes mainly Phaeocystis pouchetii) dominated Atlantic/Atlantic-influenced waters (WSC, Barents Sea, e.g., S12–S218) and picoplankton (0.2–2 µm, e.g., prasinophytes mainly Micromonas pusilla) dominated Arctic waters (EGC and from S234–S384). The distribution pattern is consistent with previous work showing a correlation with nutrient and light-limited conditions, which have been shown to drive similar patterns of protist biogeography linked with selection for ‘frugal’ picoplankton species, specifically M. pusilla6,28,29,30.
A similar pattern, was also recovered within the micro-phytoplankton (20–200 µm, e.g., bacillariophytes) distribution, where diatom diversity was demarcated between these regions where specific Thalassiosira sequence variants (centric diatom) dominate the diatom communities in the Atlantic waters (e.g., Norwegian Sea: S2 and WSC: S17–S37—Fig. 3), and specific Fragilariopsis (pennate) & Chaetoceros (centric) sequence variants dominate diatom communities in Arctic waters (e.g., EGC:S114–S132, Kara Sea: S235 and S244, Laptev Sea: S256 and S311, and UIW—Fig. 3). Fragilariopsis, is widely distributed in cold environments and often associated with sea ice32. Consistent with this observation, sampling sites that recovered high-relative representation of Fragilariopsis in the V4 rDNA diversity tag profiles were characterised by sea ice and low salinity (e.g., EGC: S132, S130 and UIW: S237, S255, S323, S360—see Fig. 3), suggesting sea ice melt conditions.
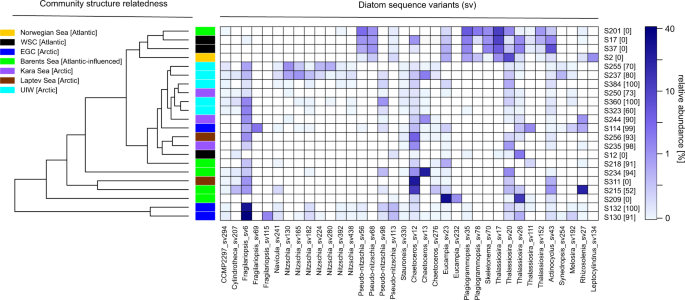
The diatoms were detected in the deep chlorophyll max in different oceanographic regions (orange, black, blue, green, purple, brown) and under sea ice (light blue), see the colour coded key. Community structure related cluster dendrogram was calculated using the Euclidean distance and, therefore, reflecting the diatom community composition similarities/differences of the sampling stations. % sea ice cover at the sampling station is listed in square brackets besides the sampling station name, down the y-axis.
Samples with high sea ice concentrations (see Figs. 1c and 3) were also commonly characterised by the presence of genera of other, known, sea ice-associated diatoms such as Nitzschia sp. and Navicula sp. Sea ice algae are important primary producers in the Arctic Ocean, capable of growth in low-light conditions and living in brine channels and ice pores24. One characteristic attribute of sea ice algae is the production of extracellular polymeric substances, heterogeneous mixtures of biopolymers (e.g., polysaccharides, proteins, nucleic acids and phospholipids), which are exuded in higher concentrations during periods of low-nutrient availability and which allow for cryoprotection and potential floatation under sea ice based on O2 inclusion33,34,35. At UIW sampling sites, two pennate sea ice genera dominated the V4 rDNA sequence tag profiles: Nitzschia (e.g., S237 and S255) and Fragilariopsis (e.g., S323 and S360) along with Chaetoceros, Navicula, and the sub-ice genus Melosira to a lesser extent (Fig. 3). As these genera have been associated with sea ice36, it is plausible that they have been released from the ice during melt conditions. In support of this scenario, Nitzschia sp. was also recovered in the sympagic community sampled close to our S237 and S255 samples by Stecher et al.37. Taken together, our sample strategy covers a wide geographic region of Arctic waters and demonstrates that the samples recovered encompass contrasting environmental conditions, including environments subject to sea ice melt changes and associated changes in the primary producer communities, including exposure to sea ice-derived diatoms.
Fungal community structure based on rDNA tag sequencing
To understand fungal community structure, we first conducted fungal-specific PCR of the ITS2 region of the rDNA gene cluster followed by Illumina amplicon sequencing for all our DNA samples. To summarise these findings, we investigated taxonomic assignment of the ITS2 sequences sampled, focusing on putative fungal sequence variants with higher representation (i.e., sequence variants with ≥1% of all sequences reads recovered—Fig. 4).
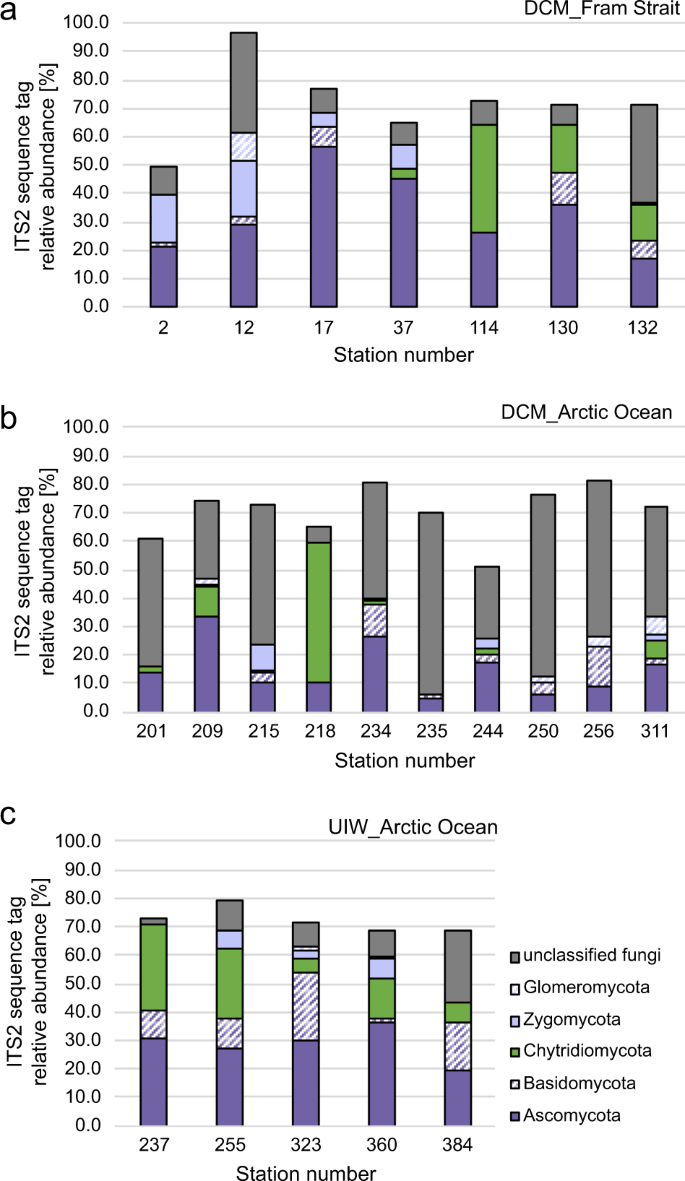
a, b Relative representation of fungal groups in the deep chlorophyll max (DCM) of the Fram Strait, including the West Spitsbergen Current (WSC) and East Greenland Current (EGC) (a) and the Arctic (b). Please note that S218 is an outlier in the Artic samples and contains a large relative representation of chytrid sequences. c Relative representation of fungal groups in the under-ice samples (UIW).
Our fungal-specific ITS2 analyses recovered a large diversity of sequences identified as ‘unclassified fungi’, suggesting the marine environments sampled harbour a diversity of previously unsampled evolutionary distinct fungal taxa or eukaryotic microbes that share similar ITS2 sequence characteristics to fungi (Fig. 4). The highest proportions of unclassified fungi were detected in the Arctic DCM samples (Ø42.2%) and lowest in UIW (Ø13%) samples. Current ITS2 database information prevents us from further investigation of the nature of this diversity or appropriate tests to confirm these sequences are correctly annotated as ‘fungal’. High numbers of unclassified fungi in Arctic DCM and UIW samples imply that the diversity of marine-derived fungi is still under-explored, particularly in remote areas such as the Arctic Ocean. This is consistent with other studies that have revealed a diversity of uncharacterised fungi and fungal-like sequence in marine environments (see ref. 7).
Glomeromycota and Zygomycota were not-detected at most stations and if present represented a low-average relative sequence representation within our samples of 1.2 and 3.8%, respectively. Basidiomycota showed a general low presentation in DCM samples, not exceeding 7% (Fig. 4a, b: EGC: 6.6%, WSC: 3.3% and Arctic: 3.9%). Higher representation of basidiomycetes was identified in the UIW samples (Ø12.6%), suggesting that basidiomycetes are associated with sea ice melt (Fig. 4c).
Ascomycota displayed a stable distribution of ~29% in UIW samples (Fig. 4c). Representation of the Ascomycota in the DCM sample varied considerably with average relative representation in the Fram Strait of 26.4% (EGC; S114–S132) and 43.5% (WSC; S12-37) and 14.7% in the Arctic (S201–S311). Previous studies of the Arctic Ocean reported ascomycetes on drift wood, (e.g., Leotiomycetes and Sordariomycetes) and in subglacial ice (Saccharomycetes)38. All three groups were recovered within the ITS2 data set. One plausible explanation for the high distribution in the WSC is the geographic location and proximity to Svalbard, characterised by coastal influence such as river runoffs and debris transport of plant matter.
The Chytridiomycota (Fig. 4) were detected with high-relative representation in many of our data sets and this group was dominated by sequence variants assigned to the class chytridiomycetes. Out of 127 Chytridiomycota sequence variants (sv) identified, 86 (72%) were classified to the orders Rhizophlyctidales (68–54%) and Chytridiales (23–18%) based on DADA2 taxonomic assignment. Follow up phylogenetic analyses of the ITS2 data are presented in Supplementary Fig. 2, showing that these two groups branch paraphyletically to each other but branch with known taxa of the class Chytridiomycetes (e.g., Batrachochytrium). Given the high variability of the ITS2 marker and short sequence alignment, we suggest these phylogenies should be interpreted as tentative. Average representation of Chytridiomycota differed strongly in the Fram Strait (Fig. 4a), with 22.5% in the EGC (S114–S132) and only 1.2% in the WSC (S12–S37). In the Arctic, Chytridiomycota accounted for ~8.3% (DCM; S201–S311), but were predominately recovered at a single sampling site (S218) and this group was consistently recovered at high-relative representation in the UIW samples (Fig. 4c) with Ø16.2% among the fungal community detected, suggesting a co-association with ice and sea ice melt conditions.
Phylogenetic placement of marine-derived chytrid V4 sequences
The V4 sequence diversity analysis consistently recovered a wide diversity of eukaryotic groups (see Supplementary Fig. 1). A relatively small proportion of these were identified as Fungi (Supplementary Fig. 3). As our ITS data indicated a relationship between chytrid detection and/or relative abundance and ice and ice melt conditions we used our V4 SSU rDNA tag sequencing data to further explore the chytrids detected. Overall, fungal group distribution supported our previous findings from the ITS2 analysis, with chytrids showing higher relative representation/abundance at low-salinity sampling sites of the EGC (e.g., S114–S132—Supplementary Fig. 3) and in UIW (e.g., S237–S384—Supplementary Fig. 3).
The advantages of V4 tags over ITS sampling is that it allows for improved phylogenetic analysis for the purpose of taxonomic comparisons. This is because SSU rDNA sequences have improved database sampling of taxonomically identified fungi and this gene region allows for improved phylogenetic resolution in comparison to trees generated from ITS sequences39. A total of 25 different sequence variants, five of which were recovered with a representation of ≥0.1% (sv261, sv479, sv671, sv714 and sv764) were sampled among the wider V4 defined eukaryotic community and were assigned to the class Chytridiomycetes. These sequence variants were placed in a Maximum Likelihood phylogenetic tree (colour coded in green) with published chytrid sequences (Fig. 5) derived from BioMarKs; European sampling locations (red)17, Arctic sampling locations (blue)14, and Arctic meltpond aggregates (purple)40. The majority of the chytrid sequence variants (17), including the five most highly represented sequences, formed one major branch together with OTU sequences from the western Arctic (100% BS support)14. Furthermore, additional chytrid-like sequence variants recovered in this study branched with Rhizophydium/Kappamyces sequences (sv1909, sv1913 and sv1247), which includes a number of sequences previously obtained from meltpond aggregates, which were sampled in the previous year on a similar sampling expedition (ARK26/3)40. Only a few chytrid sequences from European sampling campaigns (e.g., BioMarKs’ Cluster 461, 528, 655) branched in proximity to sequences from this or the Arctic Comeau study, with all of them originating from the Norway BioMarKs sampling site. No distinct diversity patterns were observed between DCM or UIW samples.
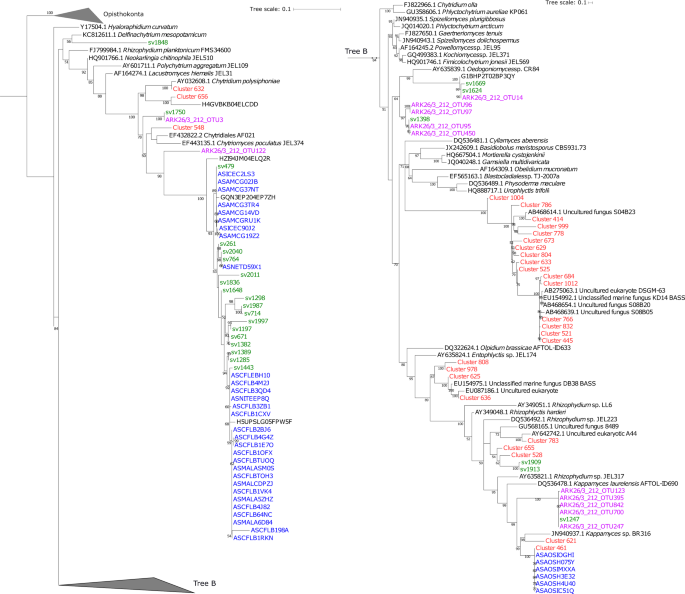
The phylogenetic tree was computed based on the maximum likelihood method in IQ-Tree including 1000 bootstrap replicates from a masked alignment of 154 taxa and 399 characters. Chytrid-like sequence variants identified as part of this study are highlighted in green (see phylotypes labelled sv#). Chytrid sequences from the BioMarKs study14 are coloured in red (see phylotypes labelled Cluster#) , from meltpond samples40 in purple (see phylotypes labelled ARK#), and from Comeau et al. in blue (see phylotypes labelled AS#) 14.
Based on individual phylogenetic analysis (Fig. 5) it was not possible to classify if any of the ITS2 sequences recovered could be paired with the V4 sequences sampled. To try and pair the different sections of the rDNA gene cluster sampled, we used local BLASTn searches with the chytrid V4 and ITS2 sequences from this paper as search seeds against the NCBI ‘nt’ and ‘env_nt’ and the 243 Tara Ocean Meta genome Assemblies (https://www.ebi.ac.uk/ena/about/tara-oceans-assemblies). Default settings were used, with tabulated output and the e-value gathering threshold was set at 1e-10. The BLASTn results were then filtered using the tool ‘awk’ to show any results with ≥2000bp hit length and 90% ID in an attempt to find DNA contigs that would allow us to infer a join between the chytrid V4 and ITS2 sequences. This approach returned no hits. To further explore putative ITS2-V4 associations we conducted a separate phylogenetic analysis for both the ITS2 and the V4 markers including ribosomal gene clusters sampled from a range of fungal genome projects of taxa related to the chytrids (Supplementary Figs. 2 and 4). Again, this analysis failed to identify phylogenetic association that would allow us to infer that the ITS2 and V4 were from the same lineage, although it consistently confirmed that both the ITS2 and V4 chytrid sequences sampled, largely from under-ice water samples and the freshening East Greenland Currents, were phylogenetically associated with the chytridiomycetes.
Drivers of Arctic fungal molecular diversity and provenance
The ITS2 fungal community composition varied across sampling sites, with salinity and sea ice concentration identified as significant environmental drivers of community difference (p ≤ 0.05—Figs. 2b and 4). In particular, ITS2 defined fungal communities from the EGC (DCM; e.g., S114, S130) and UIW (e.g., S237, S255 S384) differed from communities from the WSC (DCM, S12–S37) and Arctic (DCM; e.g., S201, S234, S256) sites. This demonstrates that fungal sequence variant distribution correlated with fresher-waters (Fig. 2b), while no significant difference in community composition relative to geographic origin was observed (Fig. 2b; ANOSIM: R = 0.07, p = 0.27). These findings suggest that sea ice-associated or sea ice melt influenced waters display an altered ITS2 defined fungal community.
Chytrids, including orders like Chytridiales, Rhizophydiales, Mesochytriales, Gromochytriales and Lobulomycetales, have been found in different Arctic habitats including: open water sites, marine sediments, sea ice and wood substrates38,41,42,43. The distribution of chytrids in the present study was patchy across sampling sites, consistent with the findings of Comeau et al.14 for the Western Arctic. Distribution patterns suggest an influence of sampling provenance with chytrids, on average, more highly represented at UIW sampling stations (Fig. 4c). Within the DCM, chytrids were mainly found in the EGC (Fig. 4a; S114–S132). As discussed above, one commonality of all sampling sites with high chytrid relative representation is the comparatively low salinity of these waters (see Table 1). This result is consistent with data from Burgeaud et al.44 who have demonstrated a higher fungal diversity and relative representation at lower salinity sampling sites across a salinity gradient in the Delaware bay. These data are therefore consistent with the proposition that salinity appears to have an important impact on chytrid diversity and community representation45.
Other abiotic parameters reported to influence chytrid distribution are light, temperature and/or nutrients16,22 and indeed model flagellated fungi have been shown to possess a sophisticated set of chemotactic and photo-tactic responses allowing them to navigate in response to light and nutrient gradients (e.g., refs. 10,11). In this study, neither light availability (identified using sea ice concentration as a proxy) nor temperature showed a strong trend for chytrid distribution.
Consistent with the ITS data, the V4 SSU rDNA phylogenies identified a proportion of unclassified chytrid-like sequences (Fig. 5). The majority of the ‘V4-chytrids’ identified here (green) clustered with OTUs from the Western Arctic Ocean (blue)14 and from those originating from an Arctic meltpond aggregate (purple)40. These results demonstrate that the putative chytrids detected in this study grouped closer to SSU rDNA sequences sampled from cold waters, providing tentative evidence of a set of ‘cold-water chytrids’. Furthermore, marine-derived fungi retrieved from the Western Arctic, displayed little overlap with representatives from Atlantic sites, suggesting that further biogeographic or environment-specific distribution patterns are evident14.
Interestingly, basidiomycetes displayed a comparably stable distribution in UIW (Fig. 4c). In the marine environment, basidiomycetes have been recovered in deep-sea sediments46 and therefore are thought to be associated with physical substrates. One hypothesis for the higher relative representation of basidiomycetes at UIW samples could be that sea ice serves as physical substrate, releasing basidiomycetes, or substrates that basidiomycetes can colonise, during sea ice melt. This explanation is consistent with a study conducted at the North Pole, where a high diversity of basidiomycetes were found in sea ice47. Floating algal aggregates under the sea ice can further form such substrates. As mentioned previously, high production of exopolymers act to increase the ‘stickiness’ of algae, which makes them inherently prone to aggregation and sedimentation after floating under the ice48,49, suggesting that sea ice algal aggregation may provide a substrate for basidiomycetes and other fungi in UIW environments—allowing for an osmotrophic/lysotrophic trophic interaction50, which otherwise would not be viable on smaller and/or dissolved particles. Consistent with this observation, basidiomycetes in this study demonstrate low-relative representation at the single multi-year ice (MYI) station S360 (Fig. 4c), where elongated filaments of Melosira arctica rather than free-floating aggregates were found51.
Co-occurrence of diatom and chytrid sequence variants
Previous work has demonstrated a co-association between chytrid taxa and diatoms in the Humboldt Current12. In the Arctic, the diatom V4 diversity profile in the environments sampled seemed to be influenced by a range of factors, including local sea ice concentration, sampling depth/strategy (DCM vs. UIW) and/or region. Highest diatom representation in the V4 diversity profile (>40%) were observed at ice-free stations (Fig. 3; e.g., S17, S37, S201). The centric diatom Thalassiosira-dominated diatom sequence assemblages at sampling stations influenced by Atlantic waters (e.g., Norwegian Sea (S2), WSC (S12–S37) and ice-free Barents Sea (S201 and S209), while the sea ice-associated diatom Fragilariopsis was most highly represented (>30%) in the EGC (e.g., S130, S132) environment, influenced by Arctic waters, higher sea ice concentrations and lower salinities, possibly as a product of sea ice melt. In comparison with the DCM samples, UIW samples showed a reduced relative representation of diatoms in the V4 diversity profiles, largely composed of ‘sea ice diatoms’ such as Navicula sp., Nitzschia sp., Chaetoceros sp., and Fragilariopsis sp. Out of the five UIW stations, S384 was sampled late in the season, and as such not sampled during sea ice melt but during sea ice formation. As a consequence, the diatom assemblage showed very few characteristic sea ice diatoms (<1%).
Correlation analysis to investigate chytrid distribution in association with potential hosts such as diatoms, chrysophytes or dinoflagellates was computed. This analysis included all sampling sites and putative host sequence variants showing a representation of at least 1% at one or more sampling site (Fig. 6). Considering that chytrid sequence variants in the V4 data set showed low-relative representation among the wider complex community, ranging between 0.01 and 0.7%, these results should be interpreted tentatively, providing only indications of putative co-occurrence. Interestingly, potential positive correlations between chytrids and diatoms were predominantly with pennate diatom species (Fig. 6a). Among pennate diatoms, Fragilariopsis (e.g., Fragilariopsis_sv6) showed the strongest potential positive correlations with chytrid sequence variants showing the highest relative representation of sequence reads (e.g., Chytridium_sv261 and Chytridium_sv764). Further positive correlations were recovered with Chaetoceros, Nitzschia and Eucampia; diatoms often associated with sea ice, while Thalassiosira (e.g., Thalassiosira_sv17 or Thalassiosira_sv111) gave rise to predominantly negative correlations. Positive correlation of three chytrid sequence variants were also found with one dinoflagellate and two chrysophytes, however their relative representation did not exceed 0.1%.
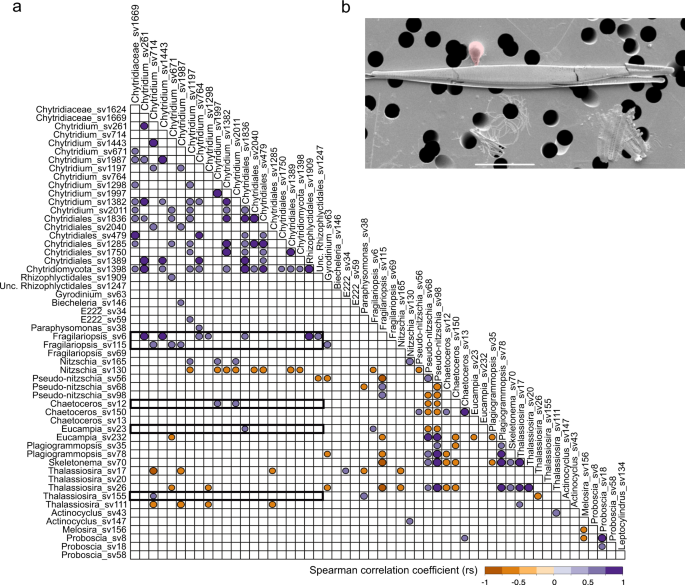
a Spearman correlation coefficient (rs) plot of abundant chytrid, diatoms, chrysophytes and dinoflagellates sequence variants based on all DCM and UIW stations. A significance threshold of p ≤ 0.01 was applied. Positive correlation coefficents between diatoms and chytrids are highlighted by a box. b Image shows pennate diatom with associated putative chytrid [zoo-]sporangium (false-colour red) sampled alongside our DNA sampling effort. This SEM was generated from a sample recovered in parallel to DNA recovered from central artic sample 491 using the same cell filtering process used for DNA extraction, hence the non-optimal SEM imaging.
To further support our hypothesis that chytrid fungi are forming interactions with pennate diatoms under melting conditions, we searched associated samples that were collected in parallel to the DNA samples using the same filter-based approach used for DNA sampling for the purposes of ‘crude’ SEM analysis. Our analysis of these samples identified one candidate image suggestive of an interaction between a chytrid [zoo-]sporangium and a pennate diatom (Fig. 6b). To further explore this possibility of such interactions, we searched a collection of SEM images from meltponds aggregates from the AeN2018707 cruise on board RV Kronprins Haakon in summer 2018. These data show a series of images where a putative fungal-chytrid hyphal or rhizoid structure is shown penetrating a pennate diatom often as part of an aggregate and with the rhizoid/hyphae attached to a putative [zoo-]sporangium consistent with the presence of such interactions in meltpond aggregate samples (Fig. 7a–f).
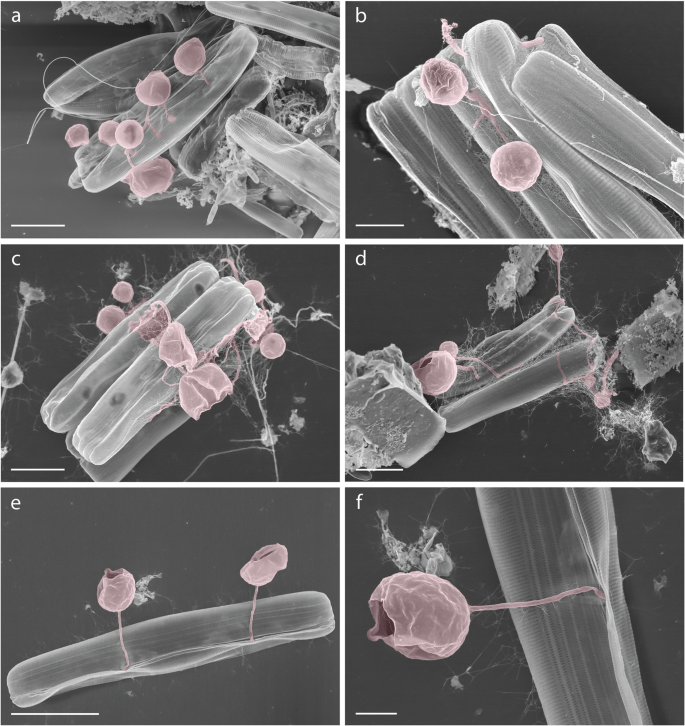
(a–f) false-colour red shows chytrid-like [zoo-]sporangium structures. f is a sub-section of e. Scale bars: a, c, d = 5 µm; b, f = 2 µm; e = 10 µm.
In order to further evaluate the role of diatoms as hosts for chytrids we made use of the ‘Ocean Sampling Day 2014’ data set, including 145 surface water sampling sites covering different locations and environmental scenarios. Computation of potential correlations between chytrids and the wider protist community showed a number of associations (Fig. 8). Out of 20 sequence variants affiliating to chytridiomycetes, three showed multiple significant correlations (Chytridiomycetes_sv1150, Chytridiomycetes_sv622 and Rhizophydiales_sv1879; p = 0.05) with different protist community members. A phylogenetic placement of these three sequence variants revealed a close phylogenetic relationship of one sequence variant (OSD_S1879; Rhizophydiales) with Arctic chytrids from the Comeau study11 (Supplementary Fig. 2). Interestingly, out of 57 correlations in total, diatom co-occurrences account for ~40% of them, supporting the role of diatoms as dominant hosts with Guinardia (centric), showing the highest correlation. This global wide sample correlation analyses further confirm the chytrid community correlation in terms of co-occurrence with diatoms.
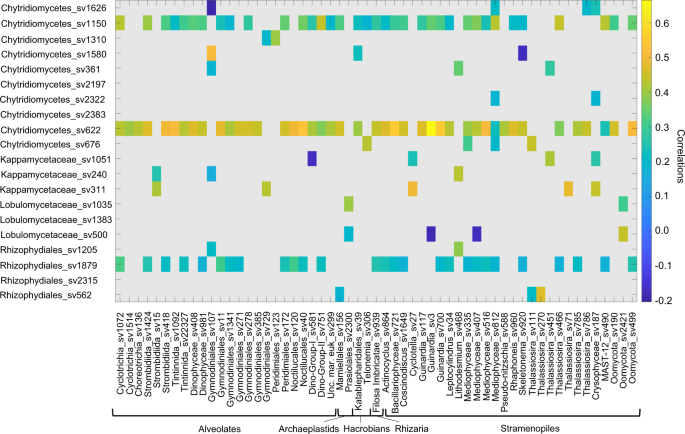
Sequence variants have been filtered based on a minimum sequence number of 100 across all sampling sites, while a correlation coefficient threshold of 0.3 and a pseudo p-value of p = 0.05 have been adopted (the stramenopile group listed here contains include predominately diatoms).
Chytrids have been shown to exert a top-down control on diatom community dynamics8. Considering, the importance of diatoms for the food-web, primary productivity and carbon export it is important to investigate the environmental factors affecting chytrid distribution and representation. In Hawaiian waters, eutrophic and mesotrophic conditions were found to correlate with chytrid infection of Cyclotella and Chaetoceros, while higher rates of attached putative chytrid zoosporangia were observed under Thalassiosira/Skeletonema predominance during austral spring in the Southern hemisphere (Humboldt Current)12,52. In this study, chytrids were primarily found at UIW sampling sites or EGC stations characterised by low salinity and a high prevalence of Chaetoceros, Fragilariopsis and Nitzschia spp., while low-relative representation of chytrid sequence variants were observed in Thalassiosira-dominated, ice-free water sites. This suggests that either abiotic conditions are directly driving the chytrid community composition or indirectly through biotic interactions, for example the composition of the diatom community, which is potentially shaping chytrid community dynamics through heterotrophic interactions.
In summer, the melting of Arctic sea ice leads to surface water stratification, salinity decrease and the formation of meltponds. In the Arctic Ocean, the distribution and population density of diatom species depends largely on the extent of light transmission through sea ice, the temperature, salinity, nutrient status, as well as the presence of heterotrophic protists and grazers. Changes in these environmental factors are hypothesised to trigger stress responses in diatoms and other primary producers, which in turn can putatively affect the susceptibility of these phytoplankton organisms to parasites. In situ infection experiments of chytrid and diatom species under various stress conditions demonstrate a higher infection density under light-stress conditions and a positive infection prevalence for Chaetoceros at low temperature (5 °C)21,23. In marine high-latitude environments, phytoplankton from north-west Iceland were prone to increased viral infection, predation and fungal parasitism under higher light and higher water temperatures22, this is consistent with sea ice melt conditions. In the Western Arctic, a link between chytrid occurrence and algal stress in relation to increased light availability was found, particularly for pennate diatoms like Pleurosigma and Navicula16,41. These findings imply a potential increase in parasite infection under prolonged light exposure during Arctic summer months. The detection of chytrids in Arctic sea ice16, therefore, suggests that occurrence of chytrids and specific diatom species is linked, either directly due a trophic relationship or indirectly derived by similar patterns of environmental selection. If it is the former and these patterns are driven by a trophic relationship, these findings collectively suggest that stress of host species induced by changes in environmental factors is a modifier of these interactions.
At UIW stations the highest representation of chytrids was associated with the highest representation of diatoms, including pennate sea ice algae and advanced sea ice melt. This pattern suggests that sea ice melt is releasing a diversity and abundance of stressed diatoms often in aggregate form, which are available for heterotrophic utilisation. Indeed, pennate diatoms of the genera Nitzschia, Navicula or Fragilariopsis were frequently observed in aggregates from first year sea ice melts from similar samples51,53. We therefore hypothesise that ice algae aggregates present an attractive micro-habitat for chytrids as shown in Fig. 7. The concentration of organic material and diatom cells is likely to trigger the recognition of chytrid zoospores and provides a habitat, which benefits osmotrophic/lysotrophic feeding50 including parasitism. Supportive evidence for our hypothesis is the detection of chytrids in meltpond aggregates from 201140 (again see Fig. 7 for evidence of chytrid-diatom interactions in meltpond aggregates), which cluster close to chytrid sequence variants identified here (see Fig. 5 for phylogenetic data).
In summary, the objective of this study was to investigate distribution patterns of fungi, specifically chytrids in Arctic waters. These phylotypes were often found in association with ice melt conditions and in co-occurrence with specific diatom genera, suggesting a potential parasite-host relationship and/or evidence of saprotrophic interaction. The study also investigates these factors in relation to abiotic parameters. Our sampling makes use of sampling during a record Arctic sea ice minimum in 2012. Salinity showed a strong influence on chytrid distribution, it is, therefore, reasonable to suggest that the interplay of salinity decrease and light increase during advanced sea ice melt has either directly (abiotic) or indirectly (biotic) influenced chytrid distribution and relative abundance. As such we hypothesise, free-floating algal aggregates under the sea ice, consisting of pennate diatoms forming putative micro-habitats for chytrid trophic associations. Furthermore, we observed a close phylogenetic relationship between chytrid sequence variants from the Arctic Ocean, identifying potential cold-water chytrid phylogroups. In a wider context, these findings suggest that chytrid prevalence in Arctic waters are likely to be altered under continuous sea ice melt conditions and freshening associated with climate change, leading to increased chytrid representation. In order to elucidate the role of chytrids in the Arctic Ocean under continuous sea ice melt, additional environmental studies are needed, including wider seasonal sampling (e.g., spring blooms) and different sea ice melt gradients and the sampling of algal aggregates associated with sea ice melt. Future work must broaden our understanding of potential host organisms, including other algae, e.g., chrysophytes or mixo-/heterotrophs like dinoflagellates and key groups of grazers.
Source: Ecology - nature.com
