Construction of tricolor fluorescent reporter strains
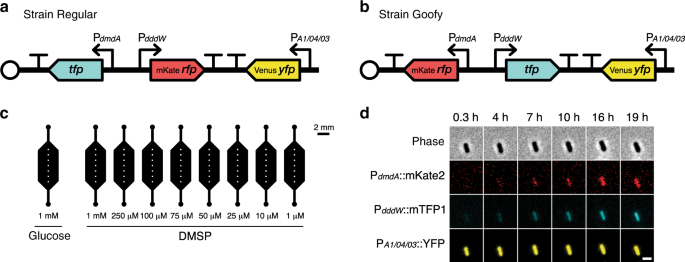
Tricolor fluorescent reporters were constructed in the marine model organism R. pomeroyi DSS-3 (wild-type strain, a gift from Prof. M. A. Moran, University of Georgia) to visually report expression of DMSP degradation genes (dddW and dmdA). DddW was chosen due to its strong upregulation response to DMSP reported in previous transcriptomic studies11,17, which suggests that DddW is the primary DMSP lyase in R. pomeroyi DSS-3. Three fluorescent proteins were chosen for brightness, monomeric structures, and spectral separation: mTFP1 (teal)36; mVenus-Q69M (yellow)37, which is the mVenus YFP38 modified with a Q69M mutation to reduce environmental sensitivity; and mKate2 (far-red)39. To control for bias caused by the choice of color of fluorescent protein (RFP or TFP) fused to each promoter region, we constructed two R. pomeroyi reporter strains (Goofy and Regular) in which we interchanged the fluorescent proteins fused to dmdA and dddW promoter regions (Fig. 1a, b).
Three promoter fusion cassettes were inserted into a single vector backbone (pBBR1MCS-2, a 5.144 kb, broad-host-range, medium copy number plasmid with a kanamycin resistance cassette and origin of replication pBBR1, originally isolated from Bordetella bronchiseptica)40,41 to enable gene expression readouts from individual cells (Supplementary Fig. 14): a dmdA promoter reporter cassette; a dddW promoter reporter cassette; and a constitutively expressed yfp cassette (Fig. 1a, b). The 500 bp sequence upstream of the dddW gene and 222 bp upstream of the dmdA gene in the R. pomeroyi DSS-3 genome were determined as putative promoter regions and used to construct promoter reporter cassettes. A strong, constitutive synthetic promoter PA1/04/03 (an E. coli lac promoter derivative)42,43 controlled the expression of YFP, whose intensity was utilized as a proxy for cell viability, plasmid copy number, and metabolic activity (Supplementary Fig. 15). Transcriptional terminators (RNAI, TSAL, TR2-17, TL17, BS7, and T7TE+) and spacer regions between promoter fusion cassettes were cloned from plasmid pZS2-12344. As an intermediate step in the construction of the tricolor reporter strains, a derivative of pZS2-123 (with its original promoters replaced with 500 bp sequence upstream of dmdA or dddW genes), pZS2-200, was built using restriction enzymes: AvrII, XmaI, XhoI, BamHI, XmnI, and SalI (New England Biolabs).
Construction of control reporter strains
Truncated versions of the tricolor reporters (Supplementary Fig. 1), each of which contained one of the promoter fusion cassettes, were built to test the effect of including three promoter fusion cassettes within one DNA construct (Supplementary Fig. 2). We also constructed constitutively fluorescent, single-color R. pomeroyi strains (Supplementary Fig. 1) to quantify spectral leakage amongst fluorescent protein colors, and to calculate the spectral leakage correction matrix, B (Supplementary Note 1 and Supplementary Fig. 16).
DNA assembly
All R. pomeroyi strains and plasmids engineered in this study are listed in Supplementary Table 1 and Supplementary Fig. 1. For assembly of the promoter fusion cassettes into the pBBR1MCS-2 vector, DNA fragments containing overlapping regions (~30 bp) were amplified with 25 cycles of polymerase chain reaction (PCR) using KAPA HiFi HotStart ReadyMix (Kapa Biosystems) with primers listed in Supplementary Table 2. Putative promoter regions of dmdA and dddW were amplified from R. pomeroyi DSS-3 genomic DNA isolated with DNeasy Blood & Tissue Kits (Qiagen). Plasmids that were used as PCR templates (Supplementary Table 3) were isolated using the QIAprep Spin Miniprep Kit (Qiagen). Primers for vector backbone amplification were designed to eliminate the multiple cloning site (MCS) within the lacZα gene in the pBBR1MCS-2 vector to prevent fusion with the β-galactosidase α-peptide. Two extra stop codons (TAATAA) were added to each fluorescent protein gene sequence through primer design.
DNA fragments were assembled using NEBuilder HiFi DNA Assembly Master Mix (New England Biolabs). Assembled plasmids were transformed into electrocompetent E. coli (NEB 10-beta; New England Biolabs) through electroporation (Gene Pulser Xcell, Bio-Rad), positive colonies were picked on X-Gal/IPTG Luria Broth (LB) plates, and correct assembly of DNA fragments was confirmed through sequencing of purified plasmids using diagnostic primers listed in Supplementary Table 2.
Transformation of R. pomeroyi through conjugation
Reporter plasmids were transformed into R. pomeroyi DSS-3 through a triparental conjugation method, which was found to be ideal due to the large sizes of our reporter plasmids (up to 7.974 kb). Overnight liquid culture of wild-type R. pomeroyi was prepared in half-strength YTSS (1/2 YTSS) containing (500 ml−1) 2 g yeast extract (BD Biosciences), 1.25 g tryptone (BD Biosciences), 10 g sea salts (Sigma-Aldrich). In addition, overnight liquid cultures of helper E. coli containing the pRK600 plasmid45 (15 μg ml−1 chloramphenicol) and donor E. coli containing a constructed reporter plasmid (50 μg ml−1 kanamycin) were prepared in LB. E. coli cultures were washed twice in 1/2 YTSS medium to eliminate antibiotics. The following mixture was concentrated and resuspended in a final volume of 100 μl 1/2 YTSS medium: 2 ml overnight culture of R. pomeroyi, 200 μl of washed overnight culture of helper E. coli, and 200 μl of washed overnight culture of donor E. coli. 50 μl of this bacterial mixture was spotted on a 1/2 YTSS plate, and incubated overnight at 30 °C to allow mating to occur. Selection for plasmid-containing R. pomeroyi was achieved by re-streaking onto a 1/2 YTSS plate amended with kanamycin (50 μg ml–1) and potassium tellurite (50 μg ml–1; Fluorochem). Like many marine microorganisms46,47, R. pomeroyi was found in this study to be resistant to potassium tellurite, while E. coli is known to be sensitive to the oxide mineral. Successfully transformed R. pomeroyi were confirmed through colony PCR and sequencing.
Bacterial culture preparation for experiments
A frozen glycerol stock of each R. pomeroyi reporter strain was streaked onto a half-strength YTSS (1/2 YTSS) culture plate containing (500 ml−1) 7.5 g agar (Bacto Agar, BD Biosciences), amended with 50 μg ml−1 kanamycin sulfate (Sigma-Aldrich), and incubated at 30 °C for 48–72 h. A single colony was picked from the plate to inoculate 1 ml of 1/2 YTSS liquid medium amended with 25 μg ml−1 kanamycin for overnight culture (~19 h) in the dark at 30 °C on an orbital shaker (200 rpm). When overnight cultures reached visible turbidity, subcultures were prepared by washing (6300 × g, 3 min) and diluting (1/75 vol/vol) overnight culture cells to a final volume of 1.5 ml in marine basal medium (MBM) consisting of 0.07 M Tris HCl (pH 7.5), 0.24 mM K2HPO4, 13.4 mM NH4Cl, 0.073 mM FeEDTA, 2% (wt/vol) sea salts, and 0.1% (vol/vol) vitamin solution48. d-glucose (10 mM) was provided as a sole amended carbon source in MBM, and kanamycin (25 μg ml−1) was added for plasmid retention. Initial OD700 of 10 mM glucose MBM subcultures ranged from 0.04 to 0.05. After a 4-h incubation in similar conditions as overnight cultures, OD700 decreased to 0.03 to 0.04, probably due to a decrease in cell size as cells transitioned from rich medium (elongated cells) to MBM (shortened cells).
To prepare for the low DMSP concentration (≤1 μM) experiment (Supplementary Fig. 7), several colonies of strain Regular cells on an agar plate were resuspended directly into MBM amended with 1 mM succinate and 50 μg ml–1 kanamycin, and grown overnight at 30 °C in the light. The overnight culture was diluted (1/50 vol/vol) into fresh 1 mM succinate MBM with kanamycin (50 μg ml–1) and incubated for an additional 4 h. Similar to other time-lapse experiments, OD700 was 0.3 before initiation of incubation with DMSP.
Carbon sources test
To assess the validity of engineered reporter strains, as well as to identify an appropriate negative control carbon source, R. pomeroyi reporter strains Regular and Goofy were incubated with a range of carbon sources, and their fluorescence response and growth were measured (Supplementary Fig. 3). Carbon sources chosen for this experiment were utilized in previous studies to cultivate R. pomeroyi. MBM solutions amended with 10 mM of the following carbon sources were prepared: DMSP (Tokyo Chemical Industry), sodium succinate dibasic hexahydrate (Sigma-Aldrich), sodium propionate (Sigma-Aldrich), sodium acetate (Sigma-Aldrich), sodium acrylate (Sigma-Aldrich), or d-glucose (Sigma-Aldrich). MBM solutions were filter sterilized (0.2 μm) after dissolution of carbon sources. The 5% 1/2 YTSS was prepared with a dilution (1/20 vol/vol) of the rich medium in non-carbon amended MBM.
Several colonies of R. pomeroyi reporter strains on agar plates were washed and resuspended in non-carbon amended MBM. Resuspended cells (2 μl) were seeded into 0.75 ml of each carbon source MBM solution amended with 25 μl ml−1 kanamycin. Incubations were performed in 2-ml microcentrifuge tubes (Eppendorf) in the dark at 30 °C with 200 rpm orbital shaking for 18.5 h before microscopy imaging.
Glucose was chosen as the most suitable negative control for the following reasons: it elicited no non-specific DMSP gene transcription response (Supplementary Fig. 3); its molecular weight is similar to DMSP; and the metabolic pathways of glucose and organosulfur compounds are distinct. The low DMSP concentration (≤1 μM) experiment (Supplementary Fig. 7) was the only instance in which succinate was used as the negative control, as it had been utilized in previous studies21,49. While succinate was also suitable as negative control (Supplementary Fig. 3), it produced slightly higher non-specific fluorescence response than glucose; thus, glucose, unless otherwise noted, was utilized as the negative control for all other experiments.
Growth curves
Growth curves of R. pomeroyi strains Regular and Goofy in different carbon sources (Supplementary Fig. 3) were measured in a flat-bottom 96-well plate (Thermo Fisher Scientific), containing 200 μl of carbon source-amended MBM per well in the absence of antibiotics. Each carbon source was prepared in triplicates, with corresponding blank wells in duplicates. Each well was inoculated with 2 μl of bacteria, grown overnight in 1/2 YTSS amended with 25 μg ml−1 kanamycin, and washed and resuspended without dilution in non-carbon amended MBM. Optical density was measured at 700 nm (OD700) to avoid spectral interference from fluorescence. The plate was incubated at 25 °C, and OD700 was measured every 1 h (3 min of fast orbital shaking before each time point) for 56 h using a Synergy HTX Multi-Mode Microplate Reader (BioTek Instruments).
Microfluidic device fabrication
The microfluidic device containing nine parallel observation chambers (Fig. 1c) was fabricated using soft lithography50. A mold for the observational chamber geometry was fabricated with SU8 on a silicon wafer. The microfluidic device was then created by casting polydimethylsiloxane (PDMS) (SYLGARD 184 Silicone Elastomer Kit; Dow Corning) onto the mold. The cured PDMS was then removed from the mold, perforated with inlet and outlet holes with a biopsy punch (1.5 mm diameter), and permanently fixed to a glass coverslip (60 mm × 24 mm; 0.17 ± 0.005 mm precision thickness; Carl Roth) by plasma bonding. Depth of each observation chamber was ~60 μm.
Microscopy
All experiments were performed using an inverted epifluorescence TE2000 microscope (Nikon) controlled through Nikon Elements software (unless otherwise specified). A Spectra X LED light source (Lumencore) provided single wavelength excitation illumination for fluorescence imaging (100% LED power unless otherwise indicated). The Perfect Focus System (Nikon) was engaged to maintain focus in time-lapse experiments. Three filter cubes (Chroma) were used for fluorescence imaging: a custom filter cube optimized for mKate2 RFP (ET580/25x excitation filter, T600lpxr band-pass filter, and ET645/75m emission filter), Chroma 49003 for YFP, and Chroma 49013 for TFP. Unless otherwise indicated, the excitation filter of each cube was removed for imaging to maximize fluorescence signal captured. At each field of view, phase contrast and fluorescence images were captured sequentially in the following order: phase contrast, red fluorescence channel (575 nm excitation), yellow fluorescence channel (508 nm excitation), and teal fluorescence channel (440 nm excitation). Bacteria were introduced into microfluidic devices, allowed to settle for 20–30 min, and imaged at the plane of the glass coverslip surface.
Images were acquired with an electron multiplying CCD (EMCCD) camera (iXon3 885; Andor Technology) (1004 × 1002 pixels; 8 μm pixel size) for the following experiments: time-lapse DMSP experiments in microfluidic chips; large-volume DMSP concentration measurement experiment (Supplementary Fig. 10); carbon sources test (Supplementary Fig. 3); DMSP uptake experiment (Supplementary Fig. 11); and phytoplankton co-incubation (Fig. 4 and Supplementary Fig. 12). For time-lapse DMSP experiments in microfluidic chips and the large-volume DMSP concentration measurement experiment, a 40× objective (CFI S Plan Fluor ELWD ADM 40×, correction collar adjusted to 0.17; Nikon) was used with electron multiplier gain at 3×, and the following exposure times: phase contrast (20 ms, 5% white LED power), red (100 ms), yellow (100 ms), and teal (200 ms). Imaging conditions for the carbon sources test were identical, except exposure time for teal fluorescence imaging was 100 ms. Time-lapse imaging for the DMSP uptake experiment was done in parallel with, but on a different microscope from, Raman microspectroscopy measurements (see below). Only phase contrast and teal fluorescence were acquired, with microscopy setup as described above. For phytoplankton co-incubation imaging, an oil-immersion 100× objective (CFI Plan Apo Lambda DM 100× Oil; Nikon) was used, without electron multiplier gain, with the following exposure times (total 240 ms per image) and LED powers: phase contrast, 60 ms, 10%; red, 100 ms, 100%; yellow, 40 ms, 50%; and teal, 40 ms, 100%.
Finally, images for the low DMSP concentration (≤1 μM) experiment (Supplementary Fig. 7) were acquired with an sCMOS camera (Zyla 4.2; Andor Technology) (2048 × 2048 pixels; 6.5 μm pixel size). A 40× objective (described above) was used, with the following camera exposure times: phase contrast, 9.8 ms, 10% white LED power; and all fluorescence channels, 200 ms.
Image analysis
Analysis of fluorescence images was performed in MATLAB (MathWorks) using an automated image segmentation and fluorescence quantification software developed in-house. Detailed descriptions of image processing and analysis methodologies for microfluidic and agarose pad co-incubation experiments are provided in Supplementary Notes 1 and 3, respectively. Briefly, cells were segmented by pixel intensity thresholding in phase contrast images. Background subtraction and spectral leakage correction were performed to enable accurate quantification of cellular fluorescence. Thresholding on YFP fluorescence intensity (proxy for metabolic activity) was applied to only include viable cells for further analyses. Finally, fluorescence signals in red and teal channels of each cell were normalized by the mean YFP signal at each time point of each experimental condition.
DMSP pathway expression time-lapse experiment
Each replicate experiment represents a biological replicate performed on a single microfluidic device containing nine observation chambers (Fig. 1c). For each replicate experiment, one of the two R. pomeroyi reporter strains (Regular or Goofy) was prepared for experimentation as described above. At the end of subculture incubation, cells were washed and concentrated by 4.5× in non-carbon amended MBM amended with kanamycin (10 μg ml−1), and distributed into nine separate microcentrifuge tubes (Eppendorf) representing each treatment condition. For each tested concentration of glucose or DMSP, a 10× concentrated stock solution was prepared in non-carbon amended MBM amended with kanamycin (10 μg ml–1). To initiate incubation, 10× stock solutions were diluted to 1× final concentration in the cell-containing MBM, resulting in a 4.05× cumulative concentration of subcultured cells. Each observation chamber was populated with 12.5 μl of treated cells. Inlet and outlet holes of observation chambers were sealed with clear tape to minimize evaporation. Since PDMS is a gas-permeable material, oxygen is not expected to be limited in our experimental setup. Cells in observation chambers were allowed to settle onto the glass coverslip surface with gravity for 20–30 min before initiation of image capture. Phase contrast and fluorescence images were captured at seven positions, determined manually before start of imaging, per observation chamber every 45 min for ~24 h. Replicate experiment 3 of strain Regular (Supplementary Figs. 4, 6, 15) contained 6 imaging positions (instead of 7) per observation chamber. All fluorescence kinetic experiments, except the low DMSP concentration (≤1 μM) experiment, were conducted at room temperature (21 °C) and in the dark. In the low DMSP concentration (≤1 μM) experiment only (Supplementary Fig. 7), 1 mM succinate was used as negative control, all experimental conditions contained 50 μg ml−1 kanamycin, and fluorescence was monitored by microscopy with image acquisition every 30 min for 7.4 h with a cage incubator set to 30 °C.
Cultivation of phytoplankton
The dinoflagellate Breviolum (strain CCMP2459, formally within genus Symbiodinium51) was chosen for its prolific production of DMSP. Breviolum cells were grown in sterile plastic culture flasks (Nunclon EasyFlasks, 25 cm3 volume; Thermo Fisher Scientific) under a diel light cycle (14 h light:10 h dark, (100 μmol m−2 s−1)) in 30 ml f/2 medium at 22 °C. Cells at 22 days post-inoculation (a 1:100 dilution into fresh medium) were harvested for experimentation at 14:00 in the afternoon. Cellular concentration was determined by counting in a microfluidic observation chamber (21 cells μl–1).
Phytoplankton–bacteria co-incubation experiment
Co-incubations between Breviolum cells and R. pomeroyi reporter strains Regular or Goofy were performed on agarose pads, which immobilized the algal cells and allowed them to establish their phycospheres (i.e., the immediate regions surrounding unicellular algae cells) through steady exudation. For agarose pad preparation, low melting temperature agarose (Promega) was combined with 1/2 YTSS medium at 15 mg ml−1, and gently dissolved in a microwave. After partial cooling, kanamycin was added at 25 μg ml−1 final concentration. Rubber gaskets (0.5 mm thickness) were manually cut into square frames (~2 cm × 2 cm inner square area) and placed on glass coverslips (22 mm × 50 mm; VWR). The inner square areas of rubber gaskets were filled with ~500 μl melted agarose–kanamycin mixture. Agarose pads were allowed to cool and solidify for 1.5 h before seeding with R. pomeroyi strains.
Bacteria were first seeded onto agarose pads and allowed to grow for 24 h without phytoplankton. Overnight cultures of R. pomeroyi strains grown in 1/2 YTSS were washed and concentrated threefold in non-carbon amended MBM amended with 10 μg ml–1 kanamycin. Ten microlitre of this concentrated cell mixture was spotted onto the center of each agarose pad, and loosely covered with a plastic lid (without contacting the agarose) to minimize evaporation. R. pomeroyi strains were allowed to grow in patches of monolayer cells on the agarose pads for 24 h at 30 °C in the light before Breviolum cells were added to initiate co-incubation.
In preparation for co-incubation with bacteria, Breviolum cells were washed and concentrated 20-fold in fresh f/2 medium amended with 10 μg ml−1 kanamycin. Prepared Breviolum cells (10 μl) were spotted onto the middle of each agarose pad containing monolayer growth of R. pomeroyi. Co-incubation agarose pads were incubated at room temperature (21 °C) in the dark, loosely covered with a plastic lid without contacting the agarose, for 24 h before imaging. Prior to imaging, a glass coverslip (60 mm × 24 mm; 0.17 ± 0.005 mm precision thickness; Carl Roth) was placed onto the agarose pads carefully to avoid agitation of established phycospheres, and flipped onto the oil immersion objective for imaging. Only one time point (24 h) was taken for microscopy, to avoid microscopy light-induced cell stress that could alter the phycosphere profile.
To calculate the spectral leakage correction matrix (Bagarose; Supplementary Note 1), different colors of single-color constitutive control strains of R. pomeroyi (Supplementary Fig. 1) were grown on separate agarose pads for 24 h without phytoplankton, and imaged as described above.
Large-volume DMSP concentration measurement experiment
To estimate the DMSP concentration evolution in microfluidic observation chambers over time, a large-volume (8 ml) experiment was performed to allow sampling for DMSP concentration measurements (Supplementary Fig. 10). The experiment, while larger in volume by ~800-times compared to microfluidic experiments, preserved cell-to-volume ratio at all steps in the protocol. Three representative initial concentrations of DMSP were chosen, each of which was incubated in triplicates: 1 μM, 75 μM, and 1 mM.
R. pomeroyi (strain Regular) was grown and prepared as described above, with modifications as described below. Three biological replicates (i.e., three different colonies as inocula) of overnight cultures were prepared in 2.5 ml of 1/2 YTSS rich medium per replicate. Overnight culture cells were washed and concentrated tenfold in non-carbon amended MBM. For each biological replicate, 153 μl of concentrated overnight culture was used to inoculate subculture flasks containing 115 ml of 10 mM glucose MBM amended with 25 μg ml–1 kanamycin. This led to a cumulative dilution factor of 1/75 (vol/vol) of overnight culture for subculture preparation, consistent with microfluidic experiments. Subcultures were incubated in the dark at 30 °C on an orbital shaker (200 rpm) for 4 h, at the end of which OD700 was measured to be 0.02–0.04. A volume of 110 ml of subcultured cells per biological replicate was washed and concentrated fivefold in non-carbon amended MBM and 7.2 ml of this concentrated cells was allocated into each treatment flask of each biological replicate (150-ml glass Erlenmeyer flasks). The addition of 800 μL concentrated DMSP solution stocks (10× concentration, i.e., 10 μM, 750 μM, and 10 mM) and kanamycin (final concentration = 10 μg ml−1) marked the initiation of incubation, with a starting volume of 8 ml. Final cumulative concentration from subcultured cells was 4.5× (nearly consistent with microfluidic experiments). One replicate of blank control flasks (i.e., without cells) representing each DMSP concentration condition was also prepared. All experimental flasks were sealed and incubated in the dark at room temperature (21.4–22.8 °C) and in the absence of agitation.
At each sampling time point, incubation flasks were swirled to resuspend sunken cells. From each flask, a 1.5-ml sample was taken for DMSP concentration measurement, and an additional 10-μl sample was placed in a microfluidic observation chamber for microscopy observation (imaged as described above). The first time point (0 h) was taken from the blank control flasks, for measurement of initial DMSP concentration. Subsequent time points, at which samples were taken from blank control flasks as well as from all replicate experimental conditions, were approximately 2, 8, and 24 h after the start of incubation with DMSP.
Each sample was immediately centrifuged at 2500 × g for 3 min to remove cells from solution. One millilitre of the supernatant was placed in an acid-washed 5-ml glass scintillation vial containing 3 ml methanol (>99.9%, HPLC gradient grade; VWR International). Sample vials were sealed and stored in the dark at 4 °C until DMSP concentration measurement using ultra-high-pressure liquid chromatography/high-resolution mass spectrometry (UHPLC/HRMS).
Chromatography/high-resolution mass spectrometry
To prepare samples for DMSP concentration measurements, 50 μl of each sample (processed and stored as described above) was diluted with 100 μl of a mixture of acetonitrile and water (9:1 v/v), centrifuged (4500 × g, 5 min), and the supernatant was used for UHPLC/HRMS measurements. All UHPLC/HRMS results were obtained on a Dionex Ultimate 3000 system (Thermo Scientific) coupled to a Q Exactive Plus Orbitrap mass spectrometer (Thermo Scientific).
UHPLC/HRMS quantification followed a previously reported protocol49: the eluent consisted of high-purity water with 2% acetonitrile and 0.1% formic acid (solvent A) and 90% acetonitrile with 10% 5 mmol l−1 aqueous ammonium acetate (solvent B). The flow rate was set to 0.60 ml min−1. A linear gradient was used for separation with 100% solvent B (1 min), 20% B (6.5 min), 100% B (7.1 min), and 100% B (10 min). The LC separation column (SeQuant ZIC-HILIC column (5 mm, 2.1 × 150 mm) equipped with a SeQuant ZIC-HILIC guard column (5 mm, 2.1 × 20 mm)) was kept at 25 °C. Electrospray ionization was performed in positive mode ionization, recording the mass range from 75 to 200 m/z, with the following parameters: capillary temperature 380 °C; spray voltage 3000 V; sheath gas flow 60 arbitrary units; and aux gas flow 20 arbitrary units. The injection volume was 2 μl.
Calibration curves for DMSP were recorded in triplicate using synthetic standards prepared as described in a previous study49. Calibration curve for DMSP: area [DMSP] = 470,540c [DMSP in nM] with r = 0.9999. Data analyses were performed using the software Thermo Xcalibur version 3.0.63.
Pre-exposure to sulfur experiment with Raman microspectroscopy
Raman microspectroscopy was utilized to infer uptake of DMSP at the single-cell level by measuring the deuterium-labeling status of cells incubated with deuterated DMSP ([2H6]-DMSP), in which the two CH3 groups of the DMSP molecule were labeled with deuterium in a protocol previously reported52 (Supplementary Fig. 11). Three incubation conditions were tested to probe the effect of sulfur satiation (due to pre-exposure of R. pomeroyi to 10 mM methionine) on DMSP uptake and cleavage pathway expression: [2H6]-DMSP without pre-exposure to methionine; [2H6]-DMSP with pre-exposure to methionine; and non-labeled DMSP without pre-exposure to methionine (negative control for Raman microspectroscopy signal).
The PdddW::mTFP1 single-color R. pomeroyi reporter strain (cleavage pathway promoter-fusion with TFP) was used to avoid spectral interference with Raman microspectroscopy measurements (see below). An overnight culture in rich medium was prepared as described above. Two subculture conditions, with or without 10 mM l-methionine (Sigma-Aldrich), were prepared in 10 mM glucose MBM amended with 25 μg ml–1 kanamycin, and incubated for 4 h as described above. Subcultured cells were washed, concentrated threefold, and resuspended in the appropriate solution for incubation: 1 mM [2H6]-DMSP MBM or 1 mM unlabeled DMSP MBM. All incubation conditions contained final concentrations of 1% methanol (solvent in which [2H6]-DMSP was dissolved) and 10 μg ml–1 kanamycin. Treated cells were incubated at room temperature (22.8 °C) in the dark for 5.5 h before imaging and Raman microspectroscopy measurements.
We utilized a commercial confocal Raman microspectroscope (LabRAM HR Evolution; HORIBA Scientific) based on an inverted microscope (Eclipse Ti; Nikon) with two cameras: an sCMOS camera (ORCA-Flash 4.0; Hamamatsu Photonics; field of view of 221.867 μm × 221.867 μm; camera #1) for fluorescence and brightfield measurements with high sensitivity; and a CMOS camera (UI-3580LE; IDS Imaging Development Systems GmbH; camera #2) for positioning the Raman laser (532-nm neodymium-doped yttrium garnet—Nd:YAG) onto each cell. After incubation of cells with deuterated or non-deuterated DMSP as described above, a 4 μl-droplet of cells was placed on a CaF2 coverslip (25 mm × 15 mm × 0.2 mm; Crystran), which was chosen to avoid background Raman signal noise53. A thin liquid column containing cells was achieved by separating the bottom (CaF2) and top (glass, 18 mm × 18 mm, no. 1 thickness) coverslips with 0.17 mm-thick glass coverslips placed along two opposing edges of the setup. As the Raman measurements took place at the surface of the CaF2 coverslip (i.e., 170 μm away from glass), this arrangement generated sufficient thickness of liquid sample in the z-direction to prevent interference from the glass material of the top coverslip54. The coverslip setup was secured onto the microscope stage with the CaF2 surface interfacing with the 60× water-immersion objective (Plan Apo IR 60XC 1.27 WI; Nikon), and was left undisturbed for 10 min to allow cells to settle to the bottom surface with gravity.
To measure the expression of the cleavage pathway, a fluorescence image in the teal channel (filter cube Chroma 49013 with excitation (445/30 nm) and emission (500/40 nm) filters installed to minimize interference with the Raman measurements performed with the 532 nm laser) was first acquired with camera #1 (50 ms exposure). A matching brightfield image (2 ms exposure, white LED light source) was also captured to visualize all cells. After fluorescence and brightfield image capture, the system was shifted to the Raman configuration (i.e., Raman laser and camera #2).
Single-cell Raman measurements were performed (1.5-s exposure time; 150-μm pinhole size) by manually moving the xy-stage to align the Raman laser (532 nm, 400 mW power), as well as to focus it (confirmed via inspection with camera #2), onto each cell. For each experimental condition sample, Raman measurements of as many cells as possible were taken within 30 min (n = 32–52 cells per treatment condition). Each cell’s Raman measurement and fluorescence signal were retrospectively matched using the brightfield image as the reference.
To determine the presence of DMSP uptake by cells, the DMSP uptake index (PDMSP) was computed for each cell
$$P_{rm{DMSP}} = frac{{I_{2040 – 2300}}}{{I_{2400 – 2450}}},$$
where I2040–2300 (numerator) and I2400–2450 (denominator) represent the integrated intensities in the Raman spectrum regions between the wavenumbers 2040 and 2300 cm–1 (the C–D peak whose intensity is affected by deuterium55) and between 2400 and 2450 cm−1 (reference region where background intensity was low), respectively.
Reporting summary
Further information on research design is available in the Nature Research Reporting Summary linked to this article.
Source: Ecology - nature.com
