The need to better understand variation in immune response in natural populations is now widely accepted26,27,28,29. Our understanding of immune responses in laboratory settings comes from animals that vary little either genetically or in prior experience. By contrast, animals in natural populations vary (perhaps extensively) in both of these. In this study, we describe the patterns of natural variation in response to a standardised immune challenge in a wild population of rodents. We identify three main categories of response: uncorrelated response, constant response and baseline-dependent response. We also identify markers, across these categories, which show particularly high individual variability in response.
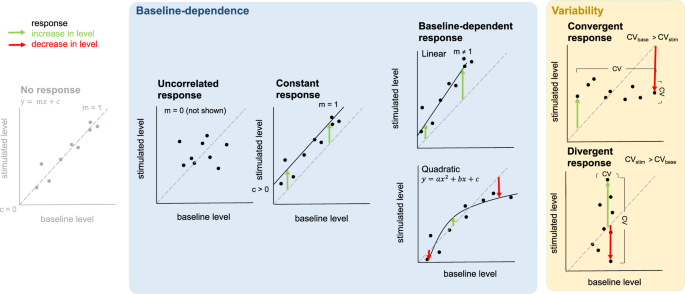
The baseline-dependent response category is the largest. Markers in this category show a relationship between baseline and stimulated abundance across individuals, and their response to stimulation is (to a lesser or a greater extent) dependent on their baseline abundance. In some cases, individuals already expressing the greatest abundance of a marker in their natural setting went on to exhibit the greatest response to stimulation by an agonist. In others, the opposite was true, and these individuals exhibited the smallest response to stimulation. Similarly, previous work on humans has identified baseline (transcriptional) predictors of influenza vaccination response30,31. These differences in baseline abundance could be driven by either genetic variation or individual differences in past experience. In humans, genetic determinants of baseline immune cell population frequencies have been identified32. Even though the stimulation we describe here was not antigen specific, previous challenge by a pathogen might also lead to changes in the baseline T-cell population within an individual’s spleen, affecting its response to any subsequent challenge. In fact, we find that voles infected with Babesia microti (a blood parasite, common in our population33) have larger spleens than uninfected voles34. This prior experience may prime an individual, enabling a greater response to subsequent challenge (e.g. slope greater than one; Fig. 1). However, individuals may also have an upper limit on the number of immune cells they have available35,36. An individual that is already mounting an immune response to a pathogen, and has a large number of activated T cells, could therefore respond less to a similar challenge than an ‘immunologically naïve’ individual (slope less than one; Fig. 1). Membership of the baseline-dependent response category recapitulates the known biology of the immune response (being highly enriched for immune ontology terms). In doing so, it validates the approach we use here, as a way of identifying markers of immune significance.
For both the uncorrelated response category and the constant response categories, individuals varied in their natural abundance of a marker but their response was unrelated to this. For the uncorrelated response category, the majority of markers occurred at a significantly higher mean abundance in stimulated samples than in baseline samples suggesting that they did nevertheless respond to stimulation. This category, which contains a moderate number of markers, also lacks any enrichment for immune-related ontology terms. This suggests that markers in this category are not conventional immune markers but could be of immune significance. We warn against omitting such markers from studies of immune response in the laboratory. They could play an important part in our understanding of the immune response, indicating for example, genetic variation in response among individuals, which is independent of baseline abundance.
The constant response category was the second largest and was moderately enriched for immune ontology terms. Markers in this category showed (on average) a constant response to stimulation across individuals. This pattern may be characteristic of markers that are of critical importance in mounting a successful immune response to a pathogen in vivo, and are therefore under tight regulation. For example, one of the top markers in the constant response category, Fyn, plays a central role in initiating T-cell activation and expansion37,38. Fyn-deficient mice have a severely compromised response to staphylococcal enterotoxin B, demonstrating the importance of this gene for mounting a successful response39. However, this is not the case for all markers in this category. Some markers showed individual variation around the average (constant) response and, for almost a third, responses of different individuals were highly variable (see below).
Cutting across this categorisation, a large number of markers displayed a pattern in which variation between individuals was particularly strong. We describe two types of such markers, both of which could be used in future studies as indicators of natural variability in immune response. Markers in the less common, convergent, response category showed much greater variation naturally than following stimulation. This pattern may be characteristic of markers showing variable levels of prior activation and some maximum or optimum abundance, resulting in a stabilisation of marker levels across the population following stimulation. We found that convergent patterns were more common among immature voles.
Assuming that individuals converge immunologically over time as they become colonised by the most common pathogens in the environment, we would expect young voles to be more variable in their levels of prior activation, as a result of their shorter and more variable exposure histories40. This could make them more likely to converge. Equally though, this could suggest that they are more constrained in the energy they have available (as a result of the competing energetic demands of growth and development) or the number of immune cells they have available (as a result of a developing immune system). Either resource constraint could result in a maximum abundance, also making them more inclined to converge. Due to the costly nature of the immune response, individuals often trade-off their investment in different arms of the immune system41,42. Different types of immune response are therefore likely to be associated with different optimum abundances (or regions) and an individual already mounting an immune response, but to a different type of challenge (associated with different cell types), may respond by down-regulating expression.
Divergent markers, which were more common, showed much greater variation following stimulation than there was naturally. This pattern may be characteristic of (but not limited to) markers showing genetic variation in response to the agonist, independent of baseline abundance e.g. subsets of animals that appear similar but respond more strongly to stimulation than others. Our own recent work, where we found an association between polymorphism in a single gene and a marker of a more tolerant immune response43, is an example of such genetic variation in response. Further supporting this hypothesis, here, we found more divergent markers among immature voles than mature voles. Assuming that individuals diverge, rather than converge, immunologically over time as a result of the cumulative influence of environmental exposure4, we would expect genetic effects to be more easily detectable in younger voles, with shorter exposure histories. Equally, though, divergent patterns could be the result of differences in early life experiences. One would also expect these to be more easily detectable in immature voles.
The divergent category (predominantly) included markers for which individuals made (on average) the same response to stimulation, and markers that did not respond (on average) to stimulation. Standard differential expression analysis would miss the individual variation present in the former group, and would fail to pick up the latter group of markers altogether. Both warn against looking at average (population-level) response, and point instead, to the value of looking at individual-level differences in response. This is particularly important because divergent markers may act as critical regulators of pathways. For example, Zap70, which demonstrates particularly high levels of individual variability in response and is centrally located in the TCR signalling pathway, interacts with many other markers (Fig. 3). We suggest that Zap70 expression could be used as a marker of response in larger studies. Indeed, it is already linked to major seasonal immune variation in wild fish44 and is being used as a prognostic marker for B-cell chronic lymphocytic leukemia in humans, with potential implications for determining a patient’s treatment path (recently reviewed in45). This example supports our assertion, in this study, that markers for which response is most variable among individuals are likely to be most useful for understanding why individuals vary in susceptibility. Other potential prognostic (or diagnostic) markers, which may have been missed using standard differential expression analysis, may be present in this category and warrant further investigation. Individual markers do not work in isolation though, and the immune system is a ‘multi-faceted defence system’46. For example, one study showed that 24 immunological parameters explained 60% of the variation in resistance to streptococcus group B in laboratory mice when combined in a multivariate analysis, providing insight which would have been missed by analysing each immunological parameter separately47. Similarly, groups of markers of prognostic and/or diagnostic value may be identified within this category by applying multivariate statistical methods.
The response categories we describe here are based on splenocytes (i) stimulated with anti-CD3 and anti-CD28 antibodies, (ii) sampled at 24 hours and (iii) assayed by RNASeq. Firstly, we chose to use a broad spectrum stimulus, as opposed to a pathogen-specific challenge, as we were looking for broadly applicable response categories. One caveat on our results is that our choice of agonist specifically activates and expands T cells. Our results may therefore exclude or underrepresent host responses that are independent of, or less strongly driven by, T cells. Furthermore, unlike an immune agonist, a pathogen is a dynamic, living organism which can multiply, evolve and interact with the host’s immune response by e.g. evasion or manipulation. In order to fully understand why individuals vary in their susceptibility to infection then, we must consider the pathogen as well as the host’s response46. We hope that future work will verify the categories we set out here using other immune agonists or, ideally, a range of pathogen-specific challenges.
Secondly, we sampled our spleen cells at 24 hours post stimulation, but the choice of time point may affect the relative frequency of the response categories reported here. Markers are known to follow different response trajectories, with some immediately responding and reaching peak activation, and others taking longer to reach this point48. Sampling at a later time point, then, when the ‘slower’ markers have reached peak activation, may lead to more convergence than reported here. In order to fully account for this temporal variation, multiple time points need to be averaged across. We argue that both time-specific and averaged responses are of functional significance, but hope others will extend our work.
Thirdly, we chose to assay expression by RNASeq, again, in order to give a broad view of the response to stimulation. Previous work has shown that transcript levels generally correlate with protein levels across genes49. However, more work is needed to confirm these response categories at this functional level50. In future, quantitative PCR (Q-PCR) or protein-level data could be used in order to include weakly expressed markers, which were excluded here as a result of the heteroscedasticity inherent in RNASeq data. Single-cell RNASeq could also be used to quantify differences in individual response resulting solely from differences in cell-specific activity.
Markers that responded to stimulation were not limited to immune pathways as conventionally defined. They included markers involved in energy generation, including the insulin signalling pathway. This is in line with previous studies, which suggest that insulin plays a key role in coordinating an organism’s response to infection, influencing, in particular, the allocation of resources51,52. The marker in question, Pdk1, was among the top convergent markers. This could be representative of the high levels of variability in the (baseline) nutritional status of individuals in a natural population, coupled with an upper limit on the processes involved in glucose metabolism.
The response categories we presented here, therefore, highlight markers not traditionally associated with immune functions, and offer a promising avenue for identifying potential prognostic (or diagnostic) factors for disease, like Zap70. They also point to both genetics and prior experience as important drivers of immune variability, providing the next challenge for understanding why individuals vary in their response to infection. The field population we study has been the subject of extensive previous study on population ecology and pathogen dynamics33,34,53,54. Our future work will, therefore, place the patterns of natural variation described here into this context, in order to decompose them into those driven by genetics and prior experience.
Source: Ecology - nature.com

