Study site
The experiment was established at the National Observation Station of Hailun Agro-ecology System, Heilongjiang province, China (47° 27′N, 126° 55′E) (Hailun Station). The experimental site is located in the center region of the Mollisols in Northeast China. The study site was very flat, with the slope less than 2 degree. The region has a temperate continental monsoon climate characterizing by simultaneously hot and rainy period from June to September in the growing season. Then the temperature sharply declined below 0 °C since October. The mean annual precipitation is 550 mm and mean annual air temperature is 1.5 °C. The soil is classified as Phaeozems54, which was developed from Loess parent material. The soil texture is predominantly silt and clay with the total content higher than 70%14 (Table 1). It is the unique climate condition, 2:1 clay nimerals (mainly vermiculite, smectite and illite), and the accumulation of relatively large amounts of organic matter in the soil, that forms the extremely fertile Mollisols with relatively high organic carbon content28,29,55.
Experimental design
A long-term vegetation restoration experiment was established in 1985. The selected soil for this experiment was under crop cultivation for more than 100 years before simulated second restoration treatments began in 1985. The initial arable land was divided into three adjacent sections, simulated restored grassland, an overgrazed bareland, and a cropland under continuous soil tillage. The grassland (1120 m2 in size) was naturally restored without any fertilizer or tillage. Leymus chinensis gradually became the dominant grass species. The estimated shoot and root biomass were about 4–9 t ha−1 and 12–43 t ha−1, respectively (data not published). The bareland (1120 m2 in size) plot was maintained by periodically removing plants by hand hoeing to simulate the effects of overgrazing or extreme land degradation. The cropland (1050 m2 in size) was maintained as a continuously tilled arable soil under a 3-year soybean (Glycine max (L.) Merrill.) – maize (Zea mays L.) – wheat (Triticum aestivum L.) rotation since 1985 and was subject to a randomized block design using three fertilization management practices with four replicates (87 m2 of each treatment plot). In this study, only the cropped treatment without chemical fertilizer and organic amendments was selected to compare with bareland and grassland, under the consideration of eliminating the effects of chemical fertilization on soil aggregate. In cropland, all crop residues were removed from the plot following harvest to simulate the common practice locally. The soil underwent conventional tilling three or four times per year, including spring disking before planting, harrowing during growing season, and autumn moldboard plowing to a depth of 0.2 m after crop harvest.
Soil sampling and analysis
The bareland and grassland field blocks were divided equally into four randomly distributed plots representing four field treatment replicates. Eight randomized soil cores (2.64 cm in diameter) per replicate were taken from a depth of 0–10 cm to make a composite soil sample after harvest of soybean on October 3, 2016. Sampling was performed in such a way so as not to break soil aggregates and to minimize compression. The soils were put into cloth bags, transported to the laboratory, part of the fresh soil samples were stored at 4 °C for soil microbial biomass carbon (SMBC), and another part were air-dried. A total of 12 field soil samples were collected. First, the air-dried bulk soil samples were broken down and then passed through an 8-mm sieve after manual elimination of visible plant litter and root residues prior to fractionation and analysis. Considering the small mass of archive soil representing the initial soil characters of the experiment in 1985, the 1985 soil sample was only used for water-stable aggregate mass fractionation, without further SOC fractionations within aggregates. The selected soil properties of the field soils and initial soil in 1985 were represented in Table 1.
Soil bulk density (SBD) was measured after drying soil cores at 105 °C for 48 h. SMBC was determined using the fumigation – extraction method56. The OC from the fumigated (24 h) and non-fumigated (control) soil were measured using a C analyzer (Shimadzu Model TOC-V). The SMB-C was calculated using a kEC factor of 0.4557.
SOC fractionation
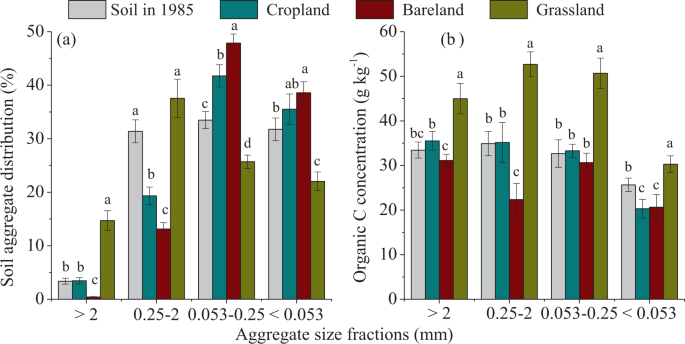
The air-dried soil samples were used to physically fractionate the soil aggregates by wet sieving14,23. First, 100-g aliquots of soil samples that had been dried at 40 °C overnight were placed on the top of a column of three sieves measuring 2, 0.25, and 0.053 mm. Then, the sieves were immersed in deionized water for 3 min and gently moved up and down by hand for a total of 50 cycles over 2 min. The remains on the sieves and those passing through the 0.053 mm sieve were collected separately. The sieving process was repeated to obtain sufficient material for density and humic substance fractionation analysis for each aggregate size fraction. The final sieving was performed to determine aggregate size distribution, total organic C, and total N in each fraction after drying in an oven at 40 °C overnight, then weighed to determine the mass distribution among the aggregate size classes, namely, large macroaggregate (>2 mm), small macroaggregate (0.25–2 mm), microaggregate (0.053–0.25 mm), and soil silt-clay unit (<0.053 mm).
Density and humic fractionation of OC within different aggregate sizes were carried out according to the method described by Golchen et al.58, Yamashita et al.3, and Dou et al.59. First, a 10-g soil aggregate sample was put into a 100-mL centrifuge tube with 50 mL of sodium iodide (NaI) solution (d = 1.8 g cm−3) and left at 20 °C overnight. The following day, after centrifugation for 15 min at 3500 revolutions·min−1, the supernatant was passed through a membrane filter (0.45 μm) into a millipore vacuum unit. The fraction recovered on the filter was washed with a 50 mL 0.01 M calcium chloride (CaCl2) solution and 100 mL distilled water and then moved to a pre-weighed 50-mL beaker. The obtained fraction was dried at 50 °C to a constant weight and used as the free light fraction (fLF). Then, the residual soil was mixed with 50 mL of NaI solution, placed in an ice bath, and sonicated at 300 J·mL−1 using a probe-type ultrasonic disintegrator. After separation, the procedure was repeated. The obtained fraction was dried at 50 °C to a constant weight and used as the occluded light fraction (oLF). The leftover soil in the centrifuge tube was washed with distilled water until the water became clear, then oven dried at 50 °C to a constant weight and used as the heavy fraction (HF).
To attain humic substances within aggregates, a 2-mm-sieved aggregate sample was extracted using a solution of 0.1 M sodium pyrophosphate (Na4P2O7) and 0.1 M sodium hydroxide (NaOH) mixture (pH 13). The soil to extractant ratio was 1:6. The mixture was shaken in a thermostatic water bath oscillator for 1 h. The supernatant and particles were separated through centrifugation for 15 min at 3500 revolutions·min−1 to extract HA and FA. The extraction supernatant was filtered into a volumetric flask and diluted to 50-mL volume using distilled water. The supernatant was decanted, then acidified with 1 M sulfuric acid (H2SO4) to pH 1 and left for 24 h at room temperature to precipitate the HA. The HA fraction was dissolved by 0.05 M H2SO4 and 0.05 M NaOH. Titration was used to analyze HA and FA fractions. The residual soil particles (Humin) were analyzed with the VarioEL CHN elemental analyzer.
Total organic C contents in bulk soil, soil aggregates, and all OC fractions within different sized aggregates were analyzed using a VarioEL CHN elemental analyzer (Heraeus Elementar VarioEL, Hanau, Germany). The Mollisol is free of carbonates.
Statistical analysis
Mean weight diameter (MWD) was calculated as an index of aggregate stability using the Eq. (1):
$$MWD=mathop{sum }limits_{i=0}^{n}{P}_{i}{S}_{i}$$
(1)
where, Si is the average diameter (mm) between (i–1)th and ith aggregate size and Pi is mass fraction of ith aggregate size.
The organic carbon content of different carbon fraction within each aggregate was calculated using the Eq. (2):
$${C}_{i}={C}_{ci}times {P}_{i}times {10}^{-2}$$
(2)
where Ci is the organic C content of ith carbon fraction (g kg−1), Cci is the organic C concentration of ith C fraction (g kg−1), Pi is the proportion of ith C fraction within each aggregate.
The ratio of OC content in each C fraction within aggregate to total SOC was calculated as the proportion of OC in total SOC (Fig. 3).
One-way analysis of variance with Tukey honestly significant difference (HSD) as a post hoc was used for means separation of SOC and total nitrogen (TN) contents, aggregate fractions, density, and humic fractions among the three field treatments and the initial soil in 1985 at P < 0.05. Principal component analysis (PCA) of the combined data of organic C in aggregate and all sub-fractions within aggregate sizes was performed to visualize the development of soil as an aggregated function of these properties. The statistical analyses were performed using SPSS 16.0 for Windows.
Source: Ecology - nature.com

