Detection of Oscillospira in the GGMP samples
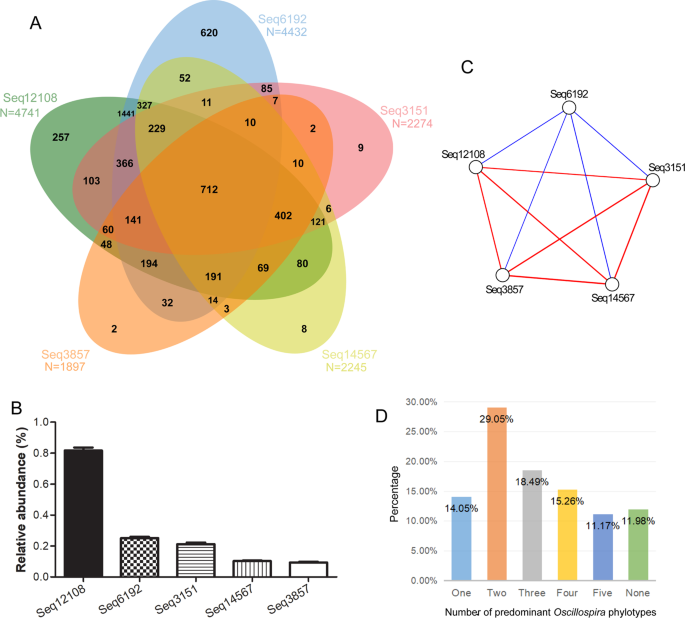
We analyzed 6376 gut microbiota samples from 6376 people. The number of reads per sample was rarefied to 10000. Oscillospira was detected in 99.15% (6322/6376) of all samples. The mean relative abundance of Oscillospira was 1.97%, ranked the 12th at the genus level. At the sub-OTU level, we analyzed the predominant Oscillospira phylotypes (defined as a sub-OTU which had more than 100 sequences in at least 1% of all samples). Their names were Seq12108, Seq6192, Seq3151, Seq14567, and Seq3857. Seq12108 was the most prevalent (detected in 74.36% of all samples) and most abundant (the mean relative abundance was 0.82%) one (Fig. 1A,B).

(A) Prevalence of predominant Oscillospira phylotypes in the Guangdong Gut Microbiome Project (GGMP). (B) Relative abundances of predominant Oscillospira phylotypes in the GGMP. (C) Internal associations of the predominant Oscillospira phylotypes. Red lines represent positive associations, blue lines represent negative associations. (D) Carrier status of predominant Oscillospira phylotypes.
To determine the internal associations of the predominant Oscillospira phylotypes, we performed co-occurrence network analysis at the sub-OTU level. We found that the phylotypes were significantly correlated to each other, among which Seq6192 was negatively correlated with the other four phylotypes (FDR-adjusted P values smaller than 0.05, Fig. 1C).
We also detected the carrier status of predominant Oscillospira phylotypes (Fig. 1D). Among all the GGMP samples, the majority (29.05%) carried two phylotypes, followed by 18.49% carrying three phylotypes; 15.26%, four phylotypes; 14.05%, only one phylotype; and 11.17%, five phylotypes.
Parameters of microbial community in relation to Oscillospira
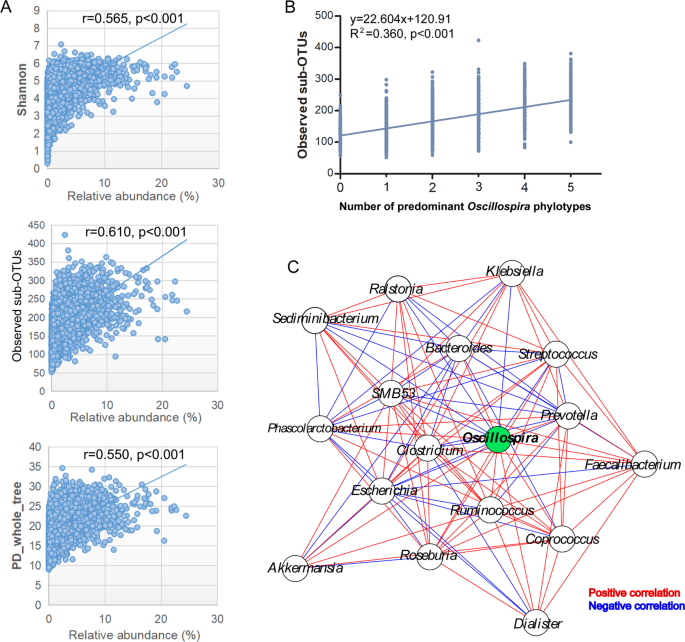
Spearman’s rank correlation test showed significant correlations between Oscillospira relative abundance and microbiota α-diversity indices (Fig. 2A). The correlations between the Shannon, PD_whole_tree and the number of observed sub-OTUs and Oscillospira were all positive (Fig. 2A), indicating a larger microbial diversitiy in people carrying a higher load of Oscillospira. Moreover, a positive correlation was found between the number of observed sub-OTUs and that of predominant Oscillospira phylotypes (spearman r = 0.5992, P < 0.001), which could be used to predict observed sub-OTUs (linear regression, F = 3590, adjusted R2 = 0.360, P < 0.001, Fig. 2B).

(A) Relative abundance of the genus Oscillospira positively correlated with Shannon index, number of Observed sub-OTUs and PD_whole_tree. (B) Correlation between number of predominant Oscillospira phylotypes and observed sub-OTUs. (C) Co-occurrence network between the major genera (defined as the genera with mean relative abundance higher than 1%). Red lines represent positive associations, blue lines represent negative associations.
Then we applied co-occurrence network analysis to estimate the association between the genus of Oscillospira and major genera (defined as the genera with mean relative abundance higher than 1%). We found that Oscillospira was positively associated with Akkermansia, Dialister, Bacteroides, Roseburia, Faecalibacterium, Prevotella, Phascolarctobacterium, Ruminococcus, and Coprococcus, and negatively associated with Sediminibacterium, SMB53, Clostridium, Klebsiella, Ralstonia, Streptococcus, and Escherichia (Fig. 2C).
Host characteristics in relation to Oscillospira
We found that the relative abundance of Oscillospira was higher in female than male (P < 0.001, Supplementary Fig. 1A). The higher the relative abundance of Oscillospira, the lower the Bristol stool type (Supplementary Fig. 1B). Differences were also found in the relative abundance of Oscillospira among different districts (Supplementary Fig. 1C).
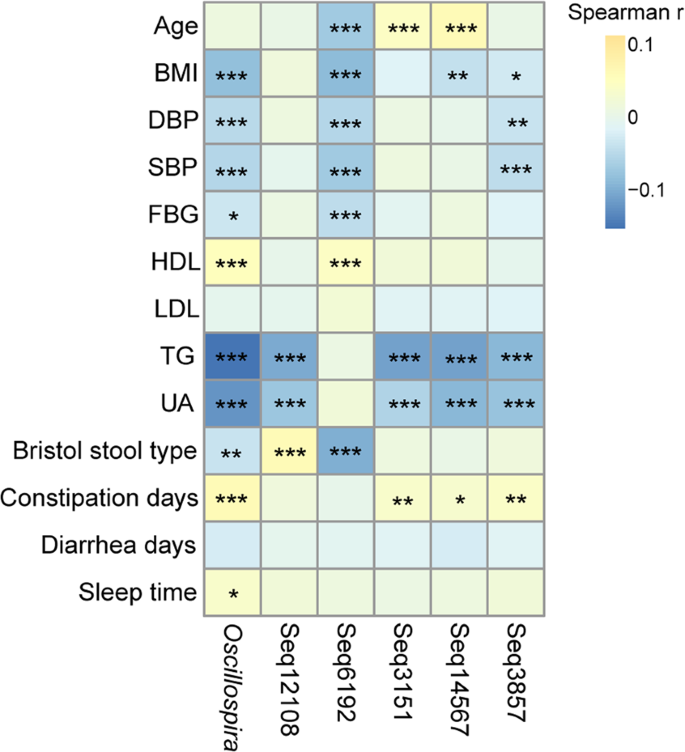
Next, we studied the correlations between Oscillospira and host physiological conditions at the genus and sub-OTU levels (Fig. 3). Age and BMI were used to confirm their correlations with Oscillospira as previously reported1,2,17,18,19; DBP, SBP, FBG, HDL, LDL, TG, and UA are indices of adiposity or metabolic disturbance in epidemiological research20,21,22; Bristol stool type and constipation days were used to study if Oscillospira was associated with slow colonic transit times as previously reported2,23; diarrhea days were used because Oscillospira was reported to be less abundant in inflammatory bowel diseases with diarrhea as one of the symptoms3,24; sleep time was used because sleep deprivation was observed to disturb human microbiota and glycometabolism25, and Oscillospira may use host glycans as substrates1. Spearman’s rank correlation test showed that the relative abundance of the genus Oscillospira was inversely associated with BMI, DBP, SBP, FBG, TG, UA, and Bristol stool type, and positively related to HDL, constipation days, and sleep time. Both the positive and negative correlations were low. Surprisingly, there were no significant differences in Bristol stool types between female and male, which was inconsistent with previous studies showing woman may have harder stools26,27. One possible reason is that the research subjects are different. At the sub-OTU level, Seq12108 was negatively correlated with TG and UA, and positively correlated with Bristol stool type; Seq6192 was negatively correlated with age, BMI, DBP, SBP, FBG, and Bristol stool type, and positively correlated with HDL; Seq3151 was negatively correlated with TG and UA, and positively correlated with age and constipation days; Seq14567 was negatively correlated with BMI, TG, and UA, and positively correlated with age and constipation days; Seq3857 was negatively correlated with BMI, DBP, SBP, TG, and UA, and positively correlated with constipation days. Inconsistent correlations at the sub-OTU level were found between age and Bristol stool type, indicating different associations of Oscillospira phylotypes with host health conditions (Fig. 3). In addition, we tested the interrelatedness between these 13 parameters, as shown in Supplementary Table 2.

Heatmap of Spearman correlation coefficients summarizing associations between Oscillospira relative abundance and host parameters regarding physical conditions at the genus and sub-OTU levels. “*” means FDR-adjusted P values smaller than 0.05; “**” means FDR-adjusted P values smaller than 0.01; “***” means FDR-adjusted P values smaller than 0.001.
Moreover, we applied multivariate association analyses (MaAsLin) to calculate the correlations between predominant Oscillospira phylotypes and host parameters. A weak negative association was found between Seq6192 and SBP. Weak positive associations were detected between Seq14567 and the intakes of fruit juice and low alcohol liquor (Supplementary Table 3).
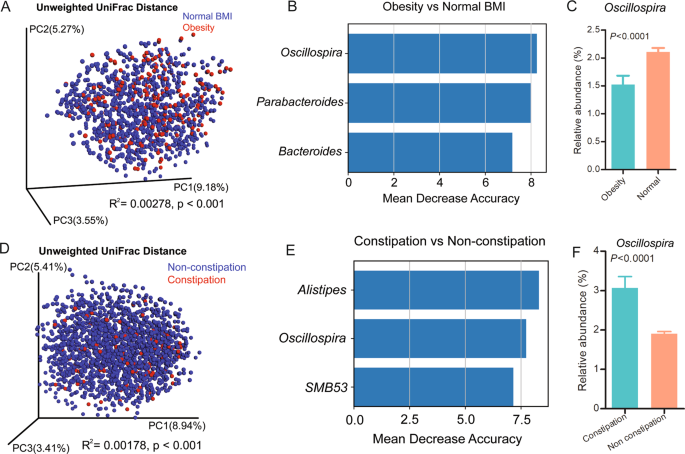
We further analyzed the importance of Oscillospira in identifying lower BMI and distinguishing constipation from non-constipation in the subset. We classified BMI according to the Guidelines for Prevention and Control of Overweight and Obesity in Chinese Adults. Adonis test based on unweighted UniFrac distance showed significant differences in microbial communities between obesity (BMI ≥ 28) and normal BMI (18.5 ≤ BMI < 24) (P < 0.001, R2 = 0.0028, Fig. 4A), between overweight (24 ≤ BMI < 28) and normal BMI (P = 0.003, R2 = 0.0012), between underweight (BMI < 18.5) and obesity (P < 0.001, R2 = 0.0075), between underweight and overweight (P = 0.017, R2 = 0.0024), and between constipation and non-constipation (P < 0.001, R2 = 0.0018, Fig. 4D). To test whether Oscillospira levels are predictive of obesity and normal BMI, we applied random forest analysis with five-fold cross validation. The number of genera was five at the lowest cross-validational error (Supplementary Fig. 2). The importance of genera measured by MDA was calculated, and Oscillospira was ranked first (Fig. 4B), indicating its significance for obesity and normal BMI in the subset. We found Oscillospira relative abundance was lower in obesity (Fig. 4C). The number of genera was 16, 83, and 3 at the lowest cross-validational error to the identification of overweight and normal BMI, underweight and obesity, and underweight and overweight, respectively; Oscillospira was ranked accordingly 16th, 12th and 12th in MDA (Supplementary Figs. 3–5). Then, we tested whether Oscillospira levels were indicators of constipation. The number of genera was 25 at the lowest cross-validational error to the identification of constipation (Supplementary Fig. 6), and Oscillospira ranked second in MDA (Fig. 4E), suggesting a weighty contribution of Oscillospira. Oscillospira was more abundant in people with constipation in the subset (Fig. 4F).

(A) β-diversity of obesity and normal BMI participants in the subset according to unweighted UniFrac distances. Red dots represent obesity participants, blue dots represent normal BMI participants. (B) Mean decrease accuracy of the top three genera discriminate between obesity and normal BMI participants in the subset. (C) Relative abundance of Oscillospira in obesity and normal BMI participants in the subset. (D) β-diversity of constipation and non-constipation participants in the subset according to unweighted UniFrac distances. Red dots represent constipation participants, blue dots represent non-constipation participants. (E) Mean decrease accuracy of the top three genera discriminate between constipation and non-constipation participants in the subset. (F) Relative abundance of Oscillospira in constipation and non-constipation participants in the subset.
Source: Ecology - nature.com


