Extraction behaviour
As the resource doubled in size between periods, all group members could extract a rate of 12.5% in each period while sustaining the resource (see Methods section for more details). In all three choice systems, the average percentage taken significantly exceeded this threshold, which led to an overall decrease of the resource over the six periods (see Fig. 1a). Extraction rates were higher in early and late periods (see Fig. 1b and Supplementary Information for analyses on time trends in extraction over the six periods). Participants knew that they would play six periods under each choice system. Only few groups exhausted the resource in earlier periods (two under individual choice, one under median choice, five under majority voting). Many groups exhausted the resource completely in period six (five under individual choice, twelve under median choice, and 15 under majority voting). As the last period depicts a different situation where sustaining the resource is no longer required, the following results regarding the average percentage taken and profits as well as analyses of the voting proposals are all based on periods one to five.
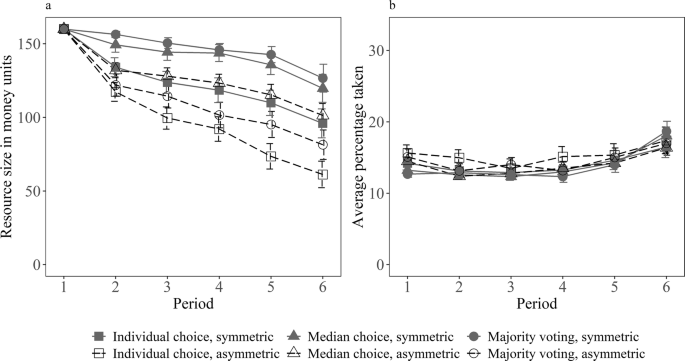
Resource size (a) and average percentage taken (b) depending on period, choice system, and asymmetry; error bars represent 95% confidence intervals.
Extraction behaviour differed depending on whether group members had asymmetric or symmetric opportunities to extract from the resource. Participants in the symmetric condition took across choice systems on average 13.20% of the resource available (SD = 2.69); this was increased significantly to 14.24% in the asymmetric condition (SD = 4.36, Cohen’s d = 0.28). Advantaged group members across choice systems took a significantly higher percentage of the resource available (M = 15.58%, SD = 5.16) than did disadvantaged group members (M = 12.90%, SD = 2.81, Cohen’s d = 0.65, see Table 1).
As we predicted, extraction behaviour also differed across choice systems. Participants took on average 14.46% of the resource (SD = 5.20) in the individual choice system, and they took significantly less in the median choice system (M = 13.32%, SD = 1.49, Cohen’s d = 0.22) and in the majority voting system (M = 13.62%, SD = 3.62, Cohen’s d = 0.21; see Table 1). The results were robust when applying a non-parametric test. A Wilcoxon signed rank test indicated that the median of differences in the average percentage taken between individual choice and median choice (Z = − 2.47, p = 0.013), as well as individual choice and majority voting (Z = − 3.03, p = 0.002) was different from zero in the expected direction. Whereas the average percentage taken decreased under median choice and majority voting for the majority of participants, we also observed cases where the average percentage taken did not change or even increased, which is reflected in the random effects for person (see Table 1). The effects of the choice systems on average percentage taken did not depend on the order of systems (see Supplementary Information).
The analysis examining the interplay of asymmetric opportunities and collective choice on extraction behaviour revealed no evidence that the collective choice systems had differential effects on symmetric versus asymmetric groups (see Table 1 and Fig. 2a). However, there was an interaction between both collective choice systems and the contrast between advantaged and disadvantaged group members, indicating differential effects of collective choice for advantaged and disadvantaged group members (see Table 1 and Fig. 2b). In the median choice system, this was characterised by a large decrease in the average percentage taken by advantaged group members (b = − 4.10, t(490) = − 7.08, p < 0.001), and a small increase for disadvantaged group members (b = 0.96, t(490) = 1.66, p = 0.097; the conditional effects describe the difference in means between two conditions under a certain condition: here, difference between average percentage taken in the median choice system and the individual choice system by disadvantaged group members). In the majority voting system, advantaged group members’ extraction level decreased (b = − 1.98, t(490) = − 4.02, p < 0.001), whereas the average percentage taken did not change for disadvantaged group members (b = 0.11, t(490) = 0.22, p = 0.828). Therefore, collective choice mainly reduced over-consumption by advantaged group members, which fostered the overall lower percentage taken. The median choice by its nature eliminated the difference in extraction levels between advantaged and disadvantaged group members, yet advantaged group members still extracted significantly more than disadvantaged group members in the majority voting system (b = 2.97, t(245) = 5.25, p < 0.001). In sum, median choice, as well as majority voting, fostered sustainable resource management in comparison to individual choice in both symmetric and asymmetric groups.
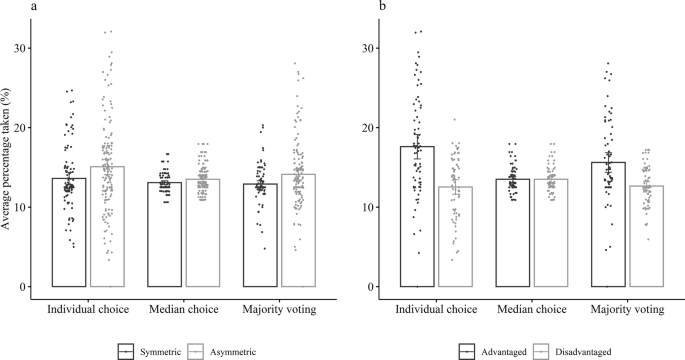
Average percentage taken across first five periods depending on choice system and (a) symmetric versus asymmetric groups, and (b) advantaged versus disadvantaged group members within asymmetric groups; error bars represent 95% confidence intervals.
Characteristics of the majority voting system
Analysing the voting proposals over periods one to five revealed that in symmetric groups elected proposals were on average below the fair and sustainable rate of 12.5% (M = 11.99, SD = 1.80) and stipulated mostly equal extraction rates for all group members (with an average variation between group members of M = 0.10, SD = 0.45). Elected proposals in asymmetric groups were equally sustainable (M = 11.76, SD = 4.46), but varied significantly more between group members (M = 0.69, SD = 1.73). In symmetric and asymmetric groups, proposals that were not elected were on average also close to the sustainable rate (symmetric: M = 12.73, SD = 4.44; asymmetric: M = 12.51, SD = 3.74), but proposed extraction rates differed substantially between group members (symmetric: M = 1.33, SD = 2.47; asymmetric: M = 2.49, SD = 2.91; t(210) = -2.98, p = 0.003). In asymmetric groups, the variation in proposed extraction levels between group members was reflected in higher proposed extraction levels for advantaged and lower proposed extraction levels for disadvantaged group members (see Figure S1 in the Supplementary Information). Overall, a proposal was less likely elected the higher the average extraction rate (b = − 0.10, z = − 2.82, p = 0.005; odds ratio (OR) = 0.90), the more the average extraction rate deviated from the sustainable rate of 12.50 in either direction (b = − 0.44, z = − 10.79, p < 0.001; OR = 0.64), and the higher the variation among group members (b = − 0.75, z = − 7.70, p < 0.001; OR = 0.47).
To further explore the effect of the majority voting system on sustainable resource use, we examined the impact of successful voting decisions which ranged over periods one to five from 0 (participants extracted individually in all five periods) to 5 (participants reached a common decision in all five periods) with a mean of 2.69 (SD = 1.68). In periods with a successful voting decision, the average percentage taken was 11.86% (SD = 2.84) compared to 15.42% (SD = 5.81, Cohen’s d = 0.73) after unsuccessful voting (i.e., individual choice) decisions. After a successful voting decision, the average percentage taken was thus decreased compared to extraction under individual choice (b = − 2.58, t(470) = − 6.67, p < 0.001), whereas the average percentage taken was even slightly increased compared to extractions under individual choice when no proposal was elected (b = 0.87, t(434) = 2.51, p = 0.012; for more details see Supplementary Information). After successful voting decisions, there were no differences in the average percentage taken between symmetric and asymmetric groups (b = − 0.23, t(245) = − 0.47, p = 0.638) or between advantaged and disadvantaged group members (b = 0.61, t(246) = 0.91, p = 0.364). If no proposal was elected, the average percentage taken differed between symmetric and asymmetric groups (b = 1.66, t(245) = 2.16, p = 0.032) and between advantaged and disadvantaged group members (b = 5.36, t(142) = 5.58, p < 0.001).
Satisfaction and fairness ratings
Individuals in groups with an asymmetric distribution of opportunities across all choice systems rated satisfaction and fairness significantly lower (M = 4.48, SD = 1.22; possible range 1–7) than individuals in groups with a symmetric distribution of opportunities (M = 4.91, SD = 1.33, Cohen’s d = 0.34; see Table 2). Within asymmetric groups, advantaged group members reported overall higher satisfaction and fairness levels (M = 4.61, SD = 1.13) compared to disadvantaged group members (M = 4.34, SD = 1.28, Cohen’s d = 0.22). Satisfaction and fairness ratings were significantly increased in both collective choice systems (median choice: M = 5.03, SD = 1.13, Cohen’s d = 0.67; majority voting: M = 4.82, SD = 1.33, Cohen’s d = 0.49) compared to individual choice (M = 4.12, SD = 1.19; see Table 2). The results were robust when applying a non-parametric test. A Wilcoxon signed rank test indicated that the median of differences in satisfaction and fairness ratings between individual choice and median choice (Z = 9.12, p < 0.001), as well as individual choice and majority voting (Z = 6.89, p < 0.001) was different from zero in the expected direction.
The analysis including the interaction of the choice systems and the asymmetry contrasts revealed no interaction of asymmetry with median choice (see Table 2 and Fig. 3a). However, asymmetry moderated the effect of majority voting on satisfaction and fairness indicating that satisfaction and fairness ratings increased significantly in symmetric groups (b = 1.05, t(486) = 7.46, p < 0.001) but only to a lesser extent in asymmetric groups (b = 0.46, t(486) = 3.88, p < 0.001). In an attempt to further explore this pattern, we tested whether asymmetric opportunities lead to fewer successful voting decisions, and whether this in turn predicts satisfaction and fairness ratings. We indeed found that for the majority voting system the number of successful voting decisions (how often a proposal was elected ranging from 0 to 5) partially mediated the effect of asymmetry on satisfaction and fairness ratings (indirect effect = − 0.43 [− 0.62, − 0.26]). Asymmetry led to fewer successful voting decisions (b = − 1.15, t = − 5.56, p < 0.001), whereas the number of successful voting decisions predicted satisfaction and fairness ratings (b = 0.38, t = 8.14, p < 0.001). The order in which participants completed the choice systems had an impact on satisfaction and fairness ratings. Specifically, symmetric groups rated individual choice more favourably when it was the first system they experienced compared to when they first experienced one of the collective choice systems. Therefore, the increase in satisfaction and fairness ratings was larger in symmetric groups when they started with collective choice. For asymmetric groups, the increase in satisfaction and fairness ratings in the majority voting system was larger when they started with individual choice (see Supplementary Information for details).
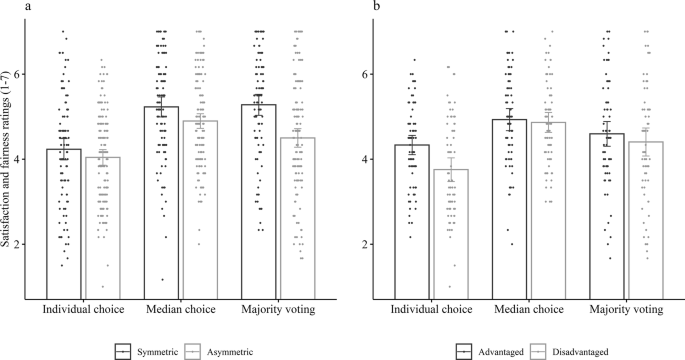
Satisfaction and fairness ratings depending on choice system and (a) symmetric versus asymmetric groups, and (b) advantaged versus disadvantaged group members within asymmetric groups; error bars represent 95% confidence intervals.
The increase in satisfaction and fairness ratings in the median choice system depended on group members’ status as advantaged or disadvantaged, indicating a smaller increase for advantaged (b = 0.60, t(486) = 3.77, p < 0.001) than for disadvantaged (b = 1.11, t(486) = 7.02, p < 0.001) group members (see Fig. 3b). The increase in satisfaction in the majority voting system compared to individual choice was also smaller and non-significant for advantaged (b = 0.26, t(486) = 1.58, p = 0.114) compared to disadvantaged group members (b = 0.65, t(486) = 3.90, p < 0.001), although the interaction term did not reach significance (p = 0.051).
Profits
Although in both collective choice systems participants took on average a lower percentage of the resource, both median choice and majority voting led to overall higher profits compared to individual choice (see Table 3 and Fig. 4). That is, individuals took a lower percentage in each period and therefore sustained a larger resource to harvest from in the next periods. Across systems, asymmetric groups earned significantly less than symmetric groups, and advantaged group members overall earned more than disadvantaged group members. The effect of majority voting in increasing profits was larger for symmetric groups (b = 10.13, t(490) = 3.87, p < 0.001) and not significant for asymmetric groups (b = 3.43, t(490) = 1.54, p = 0.124), whereas the effect of median choice did not differ between symmetric and asymmetric groups (see Table 3 and Fig. 4a). The increase in profits depended on the order of the choice systems, in that symmetric groups earned significantly more in the collective choice systems compared to individual choice when they started with one of the collective choice systems, whereas asymmetric groups earned significantly more in the collective choice systems in comparison to individual choice when they started with individual choice (see Supplementary Information). The effects of median choice and majority voting differed for advantaged versus disadvantaged group members, indicating no effect for the former (median choice: b = − 2.24, t(490) = − 0.68, p = 0.494; majority voting: b = -0.96, t(490) = − 0.30, p = 0.761) but a large increase in profit for the latter (median choice: b = 20.25, t(490) = 6.19, p < 0.001; majority voting: b = 7.82, t(490) = 2.48, p = 0.013; see Fig. 4b). Both collective choice systems therefore increased the payoff for symmetric groups and disadvantaged group members, whereas there was no effect for advantaged group members who profited equally from all three systems.
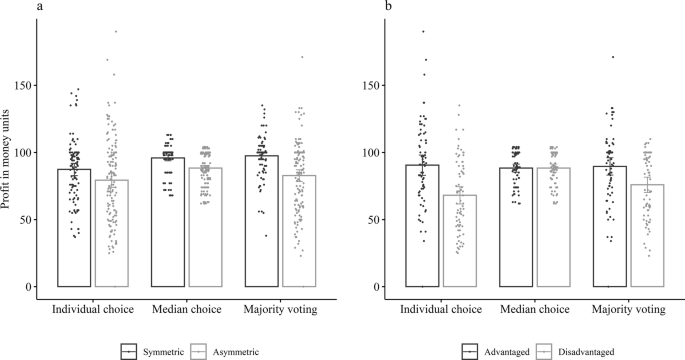
Profit in money units across first five periods depending on choice system and (a) symmetric versus asymmetric groups, and (b) advantaged versus disadvantaged group members within asymmetric groups; error bars represent 95% confidence intervals.
Source: Ecology - nature.com

