Chemical richness and composition of metabolites detected by GC-MS (polar metabolites)
The untargeted metabolite profiling of the investigated samples revealed an annotation of 285 features (detected monoisotopic signals characterized by their specific retention time and mass to charge ration) (Supplementary Table 1). A total of 66 of these features were identified and classified as metabolites of the classes alcohols (6), aldehydes (1), alkaloids (1), amines (2), amino acids (19), carbohydrates (10), lipids (4), nucleic bases or nucleotides (3) and organic acids (19). Five compounds were classified as unidentified carbohydrates (4) and unidentified lipid (1), respectively, due to their mass spectra similarity to other compounds of these classes (Table 1, Supplementary Table 1). The identified compounds in this GC-MS analysis were mainly of the primary metabolism and often of polar character. Thus GC-MS detected compounds and metabolites will be referred to as polar metabolites in the following sections.
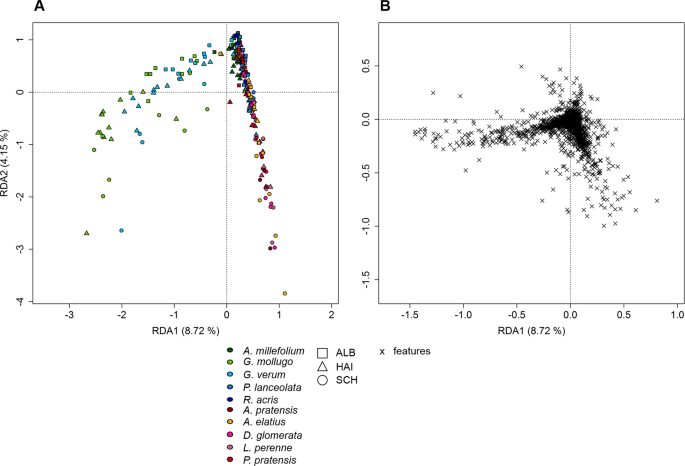
Linear mixed-effects models showed that the number of exuded metabolites (chemical richness, Fig. 1) significantly depended on species (p < 0.05), site (p < 0.001; Schorfheide, Hainich or Swabian Alb) and their interaction (p < 0.01; Supplementary Table 2a)). In contrast, the two growth forms grass and forb as a whole did not differ in their total number of exuded compounds (chemical richness), whereas those of forbs and grasses of the sites differ significantly from each other (p < 0.001; Fig. 1A, Supplementary Table 2a)). Chemical richness was highest in the Schorfheide (SCH), in particular for grasses (p < 0.001) and the forb Ranunculus acris (p < 0.01; Fig. 1A, Supplementary Table 2b)). The pattern of chemical richness was also reflected in the multivariate analysis of the metabolites composition, as revealed by a Redundancy Analysis (RDA, Fig. 2A) with species and site as constraining variables. Here, the samples of SCH were separated from those of HAI and ALB on first axis (12.59% of total variance explained, Fig. 2A), while ALB and HAI differed in their scores on the second axis (2.57%; Fig. 2A). In contrast to site, differences among species or growth forms played a subordinate role, and were only apparent on the lower axes (Supplementary Fig. 1).
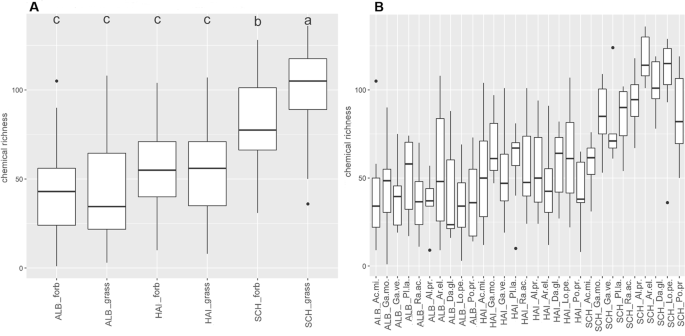
Chemical richness of polar metabolites. Boxplots display the median chemical richness (line in the box), the distribution (box) and the upper and lower quantile (lines) of the chemical richness of GC-MS detected (polar) metabolites of samples within the sample groups (A) site-growth form and (B) site-species. Points above and below the box represent outliers. A Scheffé post hoc test was performed to reveal significant differences between the sample groups. Sample groups with the same letter are not significantly different. Number of samples per group is given in Supplementary Table 9.
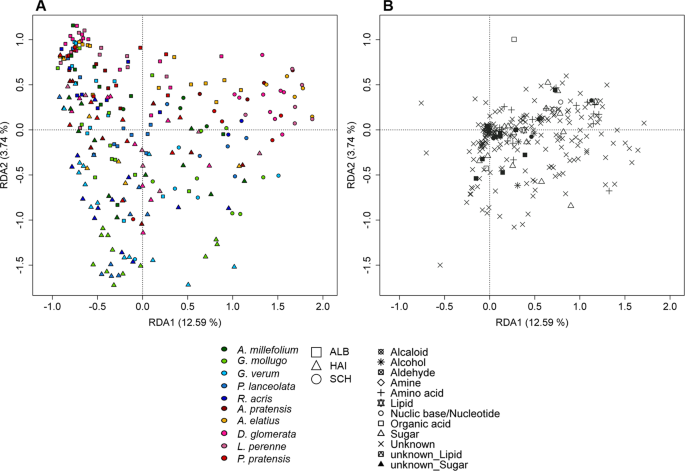
Redundancy analysis of polar metabolites. RDA was performed with 257 samples plotted against a presence/absence matrix of species per site. (A) presents axis 1 against axis 2. The ten species are indicated by colour, whereas the points are grouped by site (see legend). (B) represents the loadings of the exuded compounds of the corresponding RDA levels. The points represent the different chemical classes (see legend).
The loadings of the exuded compounds (Fig. 2B) indicated a common set of metabolites in the exudate profiles of the transplants. Those comprised metabolites of the classes alcohols, amino acids, carbohydrates, lipids, nucleic bases, organic acids, and also unidentified compounds. Some of the class members, however, showed a higher probability to occur in specific sample groups. Grasses exuded the highest number of group discriminating metabolites compared to forbs (Supplementary Table 3a)). The highest number of those metabolites was observed in plots of the ALB such as N-acetylglucosamine, favourably exuded by Poa pratensis, and succinate, especially exuded by Lolium perenne, as well as a number of unidentified compounds (Supplementary Table 3).
Discriminating exudates of grass plants grown in SCH or HAI plots showed no species-specificity, but the number of those metabolites was higher in SCH than in HAI. Instead, forb exudate profiles revealed the highest number of discriminating metabolites in plots of the HAI. Most of those could be related to a specific species, e.g. 3-Caffeoyl-trans quinic acid preferentially exuded by Galium mollugo, and many unidentified compounds (Supplementary Table 3). Forbs grown on SCH and ALB plots exuded nearly the same number of discriminating metabolites. In all sample groups, many metabolites were preferentially exuded by a specific growth form in a specific site, but not by a specific species. Simultaneously, some compounds were preferentially exuded by plants of a specific growth form or species without an influence of the site factor. For instance, octadecatrienoic acid is exuded by Plantago lanceolata of all plots, whereas 2-aminoadipate is preferentially exuded by A. elatius plants in all plots (Supplementary Table 3).
Polar metabolite composition and exogenous factors
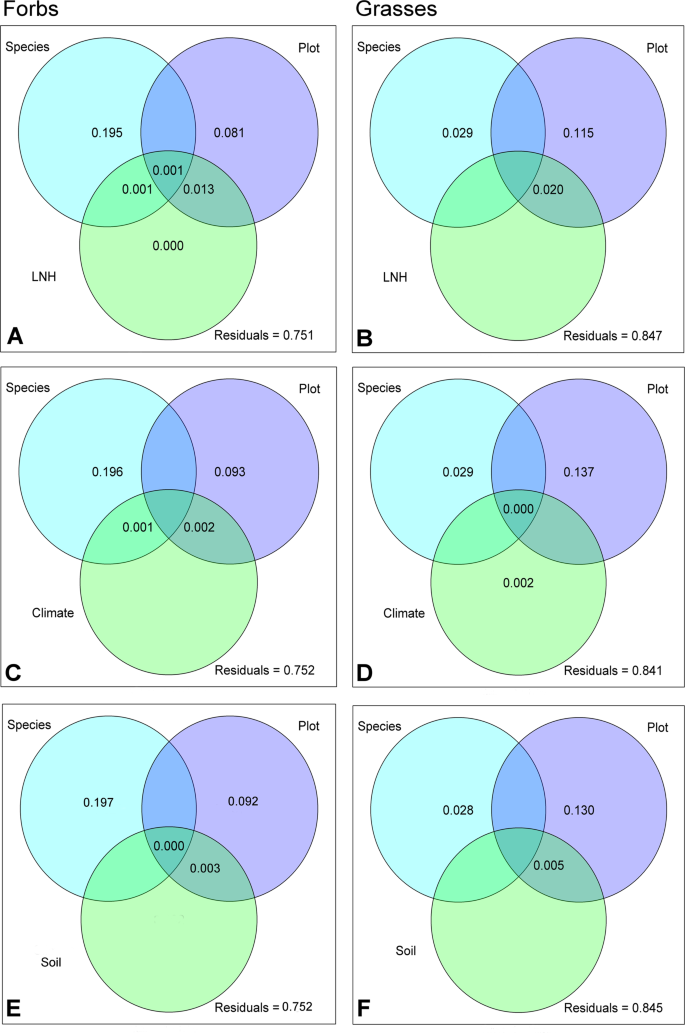
The importance of the growth location (e.g. the site) compared to species is also reflected in the variance partitioning analysis both for forbs and grasses (Fig. 3). Here, plot explained most of the variance (forbs: 23.8%, grasses: 24.4%; Fig. 3A, B). While in forbs (Fig. 3A) the second most important factor was species (8.8%), in grasses it was the interaction with the local neighbouring plants (LNH) and the plot (7.0%) together. The effect of LNH on polar metabolite composition was mainly brought about by covered area of the neighbouring plants (Cover, Supplementary Table 4). When LNH was replaced by environmental factors, either by climate and soil factors (Env, Supplementary Fig. 2, Supplementary Table 4), or by climate (Climate) and soil (Soil) separately (Fig. 3C–F), the previously described pattern remained essentially the same. Also here, plot explained most of the variation in the exudate metabolite pattern (24.0% to 24.7% for forbs, 29.5% to 30.6% for grasses), while neither climate nor soil were important at all. With minor exceptions, the same holds true for impacts of the factor land use and the single variables cumulated in the environmental factors (Supplementary Table 4). The highest amount of shared variation between plot and single variables was brought about by the combination of plot and total carbon content of the soil (TC; 2.85% and 7.38% in case of forbs and grasses, respectively; Supplementary Table 4).
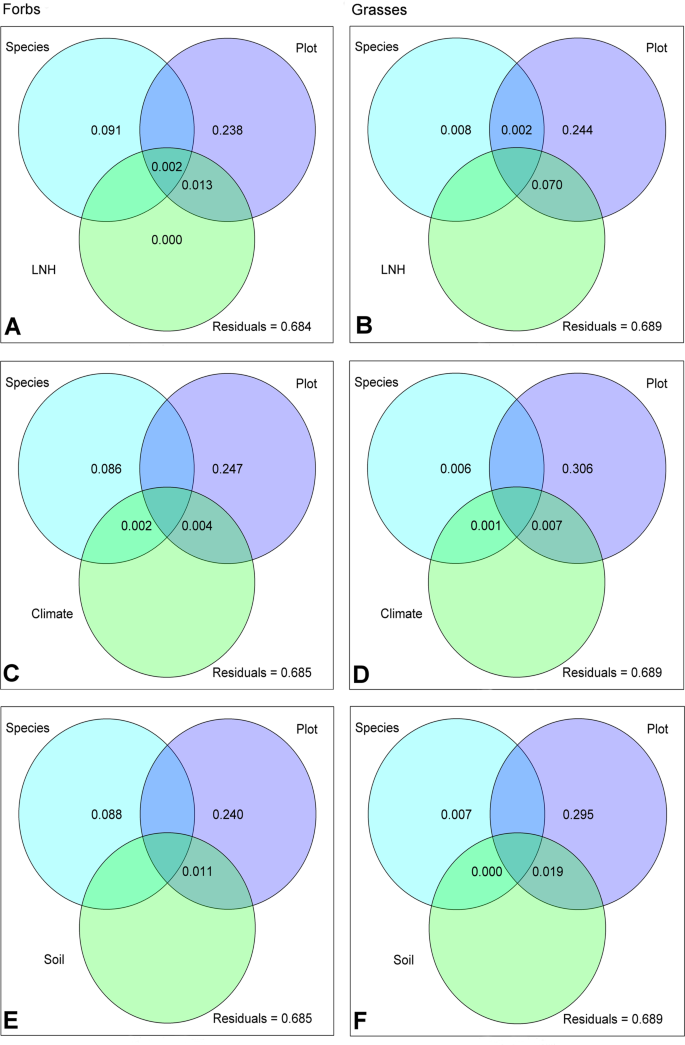
Variance partitioning of GC-MS detected (polar) metabolites. Venn diagrams present the proportion of variance in metabolite patterns of forbs (left) and grasses (right) explained by different predictors: Species = species identity of the target plant, Plot = location impact, LNH (A,B) = plant local neighbourhood community in a radius of 25 cm around the target plant, climate (C,D) = combined characteristics describing the temperature and precipitation, soil (E,F) = combined characteristics describing the soil of the location where the target plant was growing.
The correlation of single metabolites to the different environmental drivers revealed that 65.14% and 69.72% of metabolites in forb and grass exudate samples responded significantly to the environment (Supplementary Table 5a,c)). Soil variables showed the highest number of impacted metabolites followed by LNH and climate, whereas the lowest number of metabolites is linked to LUI effects in forbs and grasses (Supplementary Fig. 3, Supplementary Table 5a,c)). For instance, 101 of the polar metabolites exuded by forbs and grasses were significantly affected by soil moisture (moisture), whereas the number (Richness) and the diversity (Shannon) of species neighbouring the exuded plant and the annual temperature in 2 m height above the plant (T(200)) affected the exudation of about 80 metabolites (Supplementary Fig. 3, Supplementary Table 5a). In accordance with the results of the variance partitioning and in all LUI variables, grazing affected primary metabolites to the highest extent.
Semi-polar metabolites detected by LC-MS occur in a species-dependent manner in exudates
Untargeted metabolite profiling by LC-MS (focussing on the semi-polar metabolite fraction) revealed 2,947 features. The chemical richness of the transplant exudate profiles was independent of the growth form (p = 0.630), but significantly depended on site and species (p < 0.001, Supplementary Table 2). This was mainly driven by the grass species, which displayed a higher chemical richness in SCH plots than in all other exploratory plots (Fig. 4B, Supplementary Table 2b)). Moreover exudates from grasses and forbs grown on SCH plots showed a significantly higher chemical richness than in the other exploratories (Fig. 4A, Supplementary Table 2b). For forbs, this was mainly driven by the Galium species.The RDA of semi-polar features partly reflected these results (Fig. 5). Although a discrimination of the plant samples by site was not observed, a species-specific pattern occurred (Fig. 5A). While the two Galium species were separated from the other species on axis one (8.72%), P. lanceolata was separated from the other species on axis three (2.42%, Supplementary Fig. 4). Furthermore, A. millefolium samples were discriminated from the other species on axis four (1.71%, Supplementary Fig. 4) whereas the separation of R. acris samples occurred on axis six (1.05%, Supplementary Fig. 4). Axis five (1.44%, Supplementary Fig. 4) was the only dimension in which A. elatius, a grass, was separated from all other species, while all other grass species always clustered together. The loadings of the exuded semi-polar metabolites (Fig. 5B) indicated a common set of exuded metabolites of all species, but also a higher degree of metabolite diversity in exudate patterns of forbs than of grasses. This is reflected by the calculation of the significant specific features per species or the genus Galium (Galium spp.) together, respectively. 229 of these significant species-specific features were thereby observed in metabolite profiles of forbs (A. millefolium: 40, G. mollugo: 69, G. verum: 2, P. lanceolata: 89, R. acris: 29), whereas 47 were observed in grass profiles. Further 76 significantly specific features were discovered in Galium spp. samples.
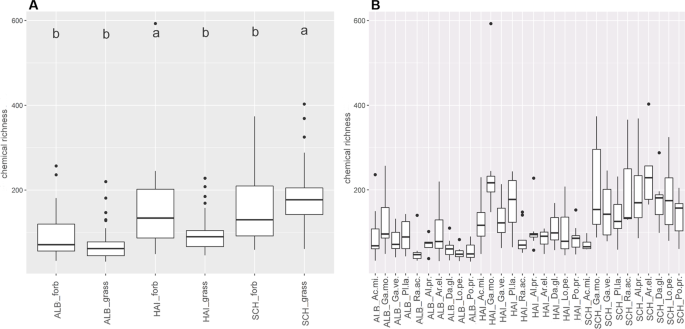
Chemical richness of semi-polar metabolites. Boxplots display the median chemical richness (line in the box), its distribution (box),quantiles (lines) and outlier (points) of the chemical richness of semi-polar metabolites of samples within the sample groups (A) site-growth form and (B) site-species. A Scheffé post hoc test was performed to reveal significant differences between the sample groups. Sample groups with the same letter are not significantly different. Number of samples per group is given in Supplementary Table 9.
Redundancy analysis of semi-polar metabolites. RDA was performed with 257 samples plotted against a presence/absence matrix of species per site. (A) The ten species (p = 0.001) are represented by colour, whereas the points are grouped by site (see legend). The plot (B) represents the loadings of semi-polar compounds.
Chemical classification of species-specific exuded semi-polar metabolites
Tandem mass spectrometry (MS/MS) provided fragment mass spectra of 217 of the 352 significant species-specific features (Supplementary Table 6). Their chemical classification revealed 116 compounds grouped into seven chemical classes with different subclasses (Table 2): glycosides (20) with different residues (acid (2), sulfate (2), hydroxycarbonic acid (1)), jasmonate derivatives (2), phenylpropanoids such a coumarin derivative (1), flavonoids (15) (glycosylated (3), kaempferol derivatives (3)), hydroxycinnamic acids (39) (glycosylated (15), not glycosylated (21) amide residues (3)), polyketides (5), terpenes (12) and compounds which could not be assigned to one of these semi-polar metabolite families but carried different chemical residues (aliphatic (7), imine residues (2), methoxy-groups (3), sulfates or phosphate groups (10)). Hierarchical clustering of the compounds according to their mass spectral fragment similarities resulted in a dendrogram with nine main branches (Fig. 6). Seven of those corresponded to the substance classes listed above, whereas two branches contained members of all chemical families and unclassified compounds (Fig. 6, Supplementary Figs. 5–12). Furthermore, the spectra of species-specific compounds showed a clustering due to species identity. Sulfated or phosphorylated compounds clustered in branch one together and were predominantly exuded by P. lanceolata (Fig. 6, Supplementary Fig. 5). The majority of glycosylated compounds and glycosides clustered in main branch two and were exuded by A. millefolium, G. mollugo, G. verum, P. lanceolata, A. elatius, A. pratensis, and R. acris plants, respectively (Fig. 6, Supplementary Fig. 6). The annotated polyketides and some potential flavonoids released by G. mollugo, G. verum, Galium spp and A. millefolium roots clustered in branch four (Fig. 6, Supplementary Fig. 8). There were two branches containing substances that resembled terpenes (Fig. 6, Supplementary Figs. 9 and 11), mainly exuded by Galium spp (branch 5) or A. elatius (branch 8). The latter also contained one of the two annotated jasmonate derivatives. Compounds of phenylpropanoid-, flavonoid- and hydroxycinnamic acid-like structures were predominantly clustered in branches six and seven, whereas branch six contained fragment spectra of Galium spp., P. lanceolata and A. pratensis specific compounds and branch seven fragment spectra of R. acris and P. lanceolata specific compounds (Fig. 6, Supplementary Fig. 10). Branches three and eight instead contained compounds of either different classes of chemically unrelated or unclassified compounds (Fig. 6, Supplementary Figs. 7 and 12). These branches are heterogeneous in the species origin. Two compounds (931.2829 m/z at 3.67 min, 501.1253 m/z at 4.07 min) were exclusively found in the exudates of P. lanceolata roots and might represent irido glycosides (Table 2).
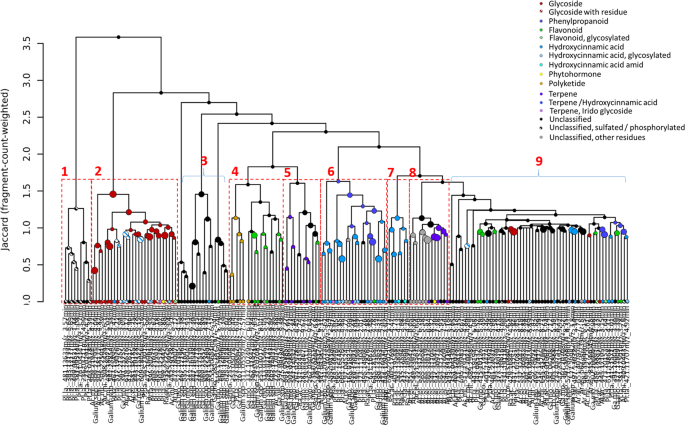
Hierarchical clustering of species-specific semi-polar exudates. Hierarchical clustering was performed on the tandem-mass spectra of the significant species-specific compounds. Cluster were calculated on spectral similarity rested on Jaccard dissimilarity and fragment-count-weighted value rating. The numbers represent the cluster which are shown in Supplementary Figs. 5–12 for more details. The classification of metabolites is given in the legend.
The exudation of semi-polar metabolite is differentially affected by the environment in case of forbs and grasses
The results of variance partitioning of the semi-polar metabolites strongly differed between the two growth forms. In sum, the predictors explained less of the variation in semi-polar exudate profiles of grasses than those of forbs (up to 15.9% and up to 24.9% for grasses and forbs, respectively, Fig. 7). For grasses the largest proportion of variance was explained by plot, in forbs most of the variation was accounted by species identity (Fig. 7A,C,E, Supplementary Fig. 2C). The predictors LNH, Climate, Soil and Env did not have any explanatory power, whereas single environmental variables explained the variability in semi-polar metabolite profiles to a minor extent (Supplementary Table 8). The inclusion of LUI as predictor resulted in a minor amount of explained variance (0.34 and 0.96% for forbs and grasses, respectively). This is caused by the effect of fertilization and grazing on the exudation of grasses and forbs (Supplementary Table 8).
Variance partitioning of semi-polar metabolite composition. Venn diagrams present the proportion of variance in metabolite patterns of forbs (left) and grasses (right) explained by different predictors: Species = species identity of the target plant, Plot = location impact, LNH (A,B) = plant local neighbourhood community in a radius of 25 cm around the target plant, climate (C,D) = combined characteristics describing the temperature and precipitation, soil (E,F) = combined characteristics describing the soil of the location where the target plant was growing.
The correlation of semi-polar metabolite profiles with single environmental variables revealed a strong environmental impact on the exudation of many secondary metabolites (Supplementary Table 5b,c)). 21.90% and 17.49% of compounds detected in forb and grass exudate samples, respectively, could be linked to one of the environmental variables (Supplementary Fig. 13). Soil variables such as moisture and soil texture but also the climate variable precipitation and T(200) were significantly correlated to semi-polar compounds (Supplementary Fig. 13, Supplementary Table 5b,c)). In general, LUI and LNH variables had a similar effect on the metabolite exudation. In particular, mowing is the variable of LUI with the highest number of affected features (forbs: 89, grasses: 80), whereas Cover was involved in the exudation of 106 features and Shannon in 101 features in forbs and grasses, respectively (Supplementary Fig. 13, Supplementary Table 5b,c)). Interestingly, there are species-specific compounds among these correlated compounds (Supplementary Table 5b)). For instance, LUI traits could be linked to compounds of the phenylpropanoid metabolism and glycosides of various species. Furthermore, compounds of hydroxycinnamic acid-like character exuded by A. millefolium (619.1862m/z_3.12 min), G. mollugo (381.0621 m/z_7.17 min) and P. lanceolata (445.2057 m/z_3.4 min) were significantly correlated to climate variables, whereas flavonoids exuded by G. mollugo (507.2066 m/z_4.98 min), G. verum (389.1117 m/z_3.09 min) and P. lanceolata (645.1817m/z_4.78 min) or potential terpenes released by the Galium spp. (267.0304 m/z_9.64 min) and A. elatius (549.3422 m/z_7.18 min) were significantly correlated with soil variables.
Source: Ecology - nature.com

