Soil characteristics
The physiochemical parameters of the paddy soil during the different rice growth stages are shown in Fig. 1. The pH value increased in the 1% RSBC, 1% SMBC, 5% RSBC and 5% SMBC-supplemented soils in that order compared to the control samples. Thus, SMBC had a greater alkalization effect than RSBC at both application rates (Fig. 1a). In addition, the soil pH during rice growth was highest with the addition of 5% SMBC due to its higher ash content and CEC (see Supplementary Table S1). The SOC content in the different groups ranged from 16.92–39.08, 17.59–23.80 and 15.23–26.26 mg g−1 during the elongation, heading and maturation stages respectively (Fig. 1b), and was higher in the biochar-supplemented soil compared to the control soil, indicating that biochar also retarded soil mineralization. Furthermore, addition of SMBC resulted in greater SOC compared to RSBC.
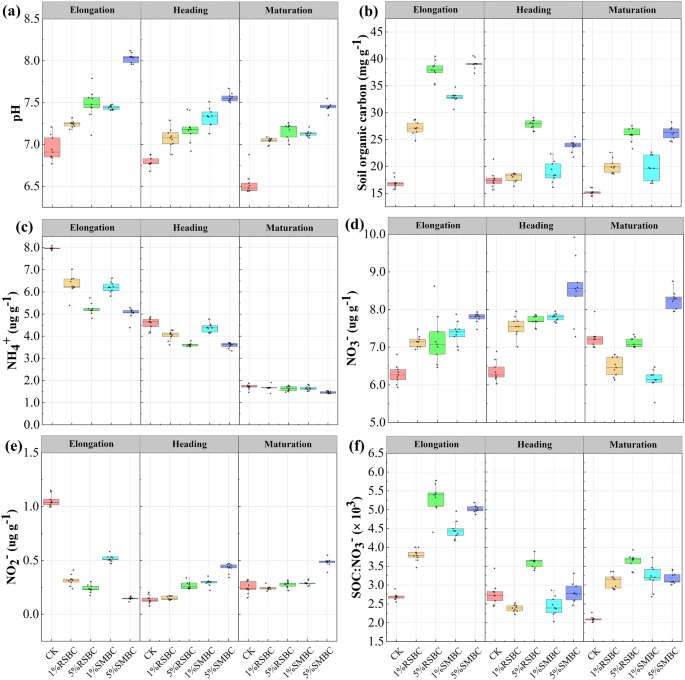
Soil physiochemical parameters during rice growth among treatments. (a), soil pH; (b), soil organic carbon; (c), soil NH4+ concentration; (d), soil NO3− concentration; (e), soil NO2− concentration; (f), rate of soil SOC: NO3−.
Soil NH4+, NO3− and NO2− levels were also significantly influenced by biochar application (see Supplementary Table S2, Fig. 1c,d). The NH4+ levels were significantly higher in the control soil samples relative to the biochar-treated soil during the elongation and heading stages, and the difference between the control and SMBC groups was always significant during the maturation stage (P < 0.05, see Supplementary Table S2). In contrast, biochar application significantly enhanced the NO3− levels, and 5% SMBC resulted in maximum increase during all stages of growth. Consistently, the NO3− levels were highest in the SMBC-treated compared to other treated soils during the maturation stage (Fig. 1d). The soil NO2− levels ranged from 0.15 to 1.03, 0.13 to 0.43 and 0.25 to 0.49 µg g−1 respectively in the elongation, heading and maturation stages. In the elongation stage, 5% SMBC minimized NO2− levels, which increased again during the heading and mature stages (Fig. 1e). Finally, biochar application significantly increased the SOC:NO3− ratio compared to the control (P < 0.05, Fig. 1f) depending on the application rate. Taken together, biochar induces significant changes in the physicochemical characteristics of soil, which likely affect the rate of N2O emission.
Soil enzymes activity
The activities of nitrate reductase (NR) and urease (UR) differed between the control and biochar-supplemented soils, as well as between the RSBC and SMBC-treated samples. As shown in Fig. 2, biochar application markedly inhibited NR activity during the elongation and heading stages of rice growth (P < 0.05), while no significant effect was seen in the maturation stage regardless of the biochar type and application rate (see Supplementary Table S2). In contrast, biochar application increased the soil UR activity compared to control, and consistent with the trends in NR activity, the effect of application rate was significant only during the elongation and heading stages (P < 0.05) and not in the maturation stage (see Supplementary Table S2).
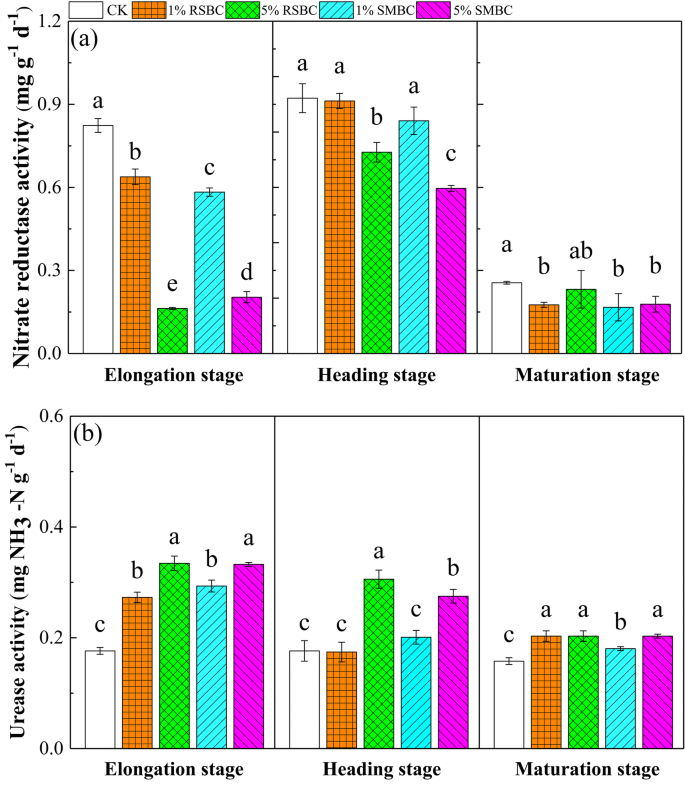
Effect of biochar application on soil nitrate reductase (a) and urease activity (b) in paddy soil at rice growth stages. Different letters above columns indicate significant differences at P < 0.05. Errorbar represented standard error of mean (n = 9).
Soil N2O emission
The N2O flux in the soil during the three growth stages of rice is shown in Fig. 3, which indicates a relatively consistent trend and a pulse-like pattern across all treatments. The N2O emission was highest 2 h after incubation and slowed after 5 days during all growth stages, indicating that the N2O flux primarily occurred soon after biochar application. At the elongation stage, N2O flux peaked at 2 h and 5 days after incubation. In addition, the highest N2O flux was seen in the control soils lacking biochar, and decreased in the 1% RSBC, 1% SMBC, 5% RSBC and 5% SMBC-supplemented soils in that order, which clearly indicated that adding more biochar lowered N2O emission. At the heading and maturation stages, the largest N2O flux was seen in the control samples 2 h after incubation. Interestingly, no significant differences were seen between the RSBC and SMBC groups after 1 day of incubation, suggesting that the effect of biochar on N2O emission is transient.
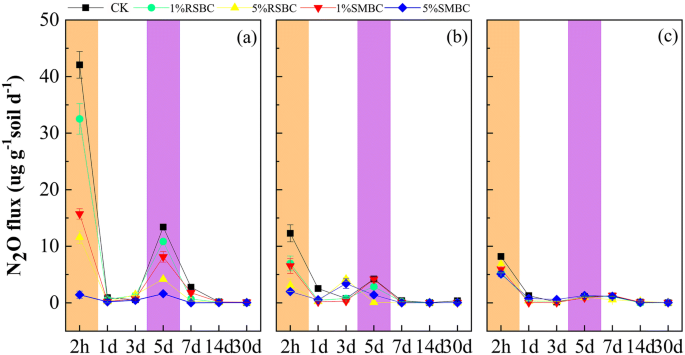
Soil N2O fluxes during 2 h-30 days of the incubation at elongation stage (a), heading stage (b), maturation stage (c). Errorbar represented standard error of mean (sem).
The cumulative N2O emission decreased significantly with biochar addition by 45.14–73.96% (P < 0.05; Table 2) compared to that of the control soil at all stages of growth. In addition, SMBC resulted in lower cumulative N2O emission compared to RSBC at the same application rate. The average cumulative N2O emission in the control, 1% RSBC, 1% SMBC, 5% RSBC and 5% SMBC samples were 123.1, 67.53, 64.63, 43.16 and 32.06 μg g−1 respectively. Thus, even after considering the difference between the various feedstocks, biochar derived from swine manure always showed better mitigation effect on N2O emission compared to that derived from rice straw.
Relationship between soil properties and N2O emission
Regression analysis showed that soil pH, SOC, NH4+ and NO3− were significantly correlated to the cumulative N2O emission during the elongation and heading stages (Fig. 4). N2O emission was negatively correlated with pH, SOC and NO3− levels, and positively correlated with soil NH4+ levels during elongation. The higher slope values in the regression equation demonstrated that N2O emission was highly sensitive to the soil indices, and peaked in the initial stages of rice growth before stabilizing in the heading and maturation stages.
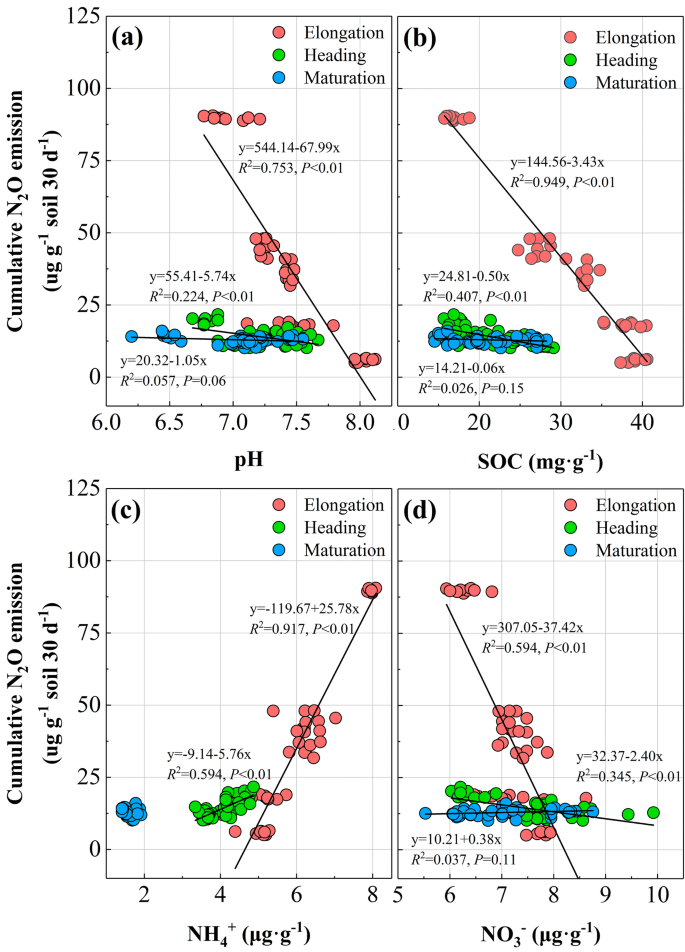
Regress analysis between soil properties and cumulative N2O emission during rice growth. (a), pH; (b), SOC; (c), NH4+; (d) NO3−.
The PCA analysis indicated that biochar application significantly affected N2O emission and soil properties, especially in the elongation stage (Fig. 5). RDA further showed that the first and second axes accounted for 45.6% and 17.72% of the total variation in the cumulative N2O emission (pseudo-F = 24.9, P = 0.002; Fig. 5). Biochar type and application rate significantly affected the cumulative N2O emission, which correlated positively with NO2− and NH4+ levels and the NR activity, and negatively with NO3−, pH and SOC. Modified SEM was performed to evaluate the potential causal pathways of biochar type and application rate on N2O emission (Fig. 6). Fit statistics for the modified SEM showed an acceptable fit of the model (P = 0.068 and 0.054, respectively). The soil properties explained 90.8% and 90% variations in N2O emission with different biochar types and application rates respectively (Fig. 6). In addition, NO2− and NH4+ levels were the most important factors controlling N2O emission affected by biochar, pH urease activity and NO3− concentration. The biochar type and application rate also strongly affected SOC, urease activity and pH, which in turn controlled the soil NH4+ and NO3− levels. In contrast, NO3− level had a relatively weaker effect on N2O emission (Fig. 6). The standardized total effect, i.e. the sum of direct and indirect effects, on N2O emission was highest for NO2−, followed by NH4+. Biochar type and application rate had a negative standardized total effect (STE) on N2O emission, with higher application rates resulting in greater suppressive effect regardless of the biochar type (Fig. 7).
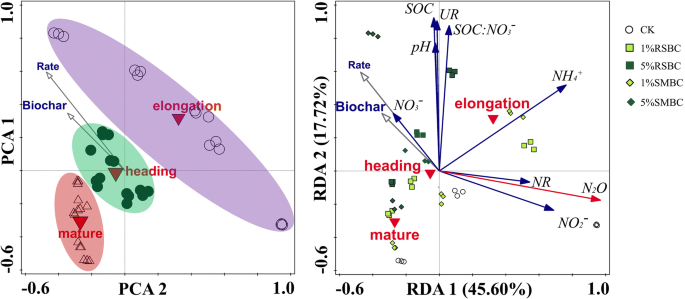
Principal Component Analysis (PCA) and redundancy Analysis (RDA) of the effect of biochar and application rate on cumulative N2O emission and soil physicochemical properties.
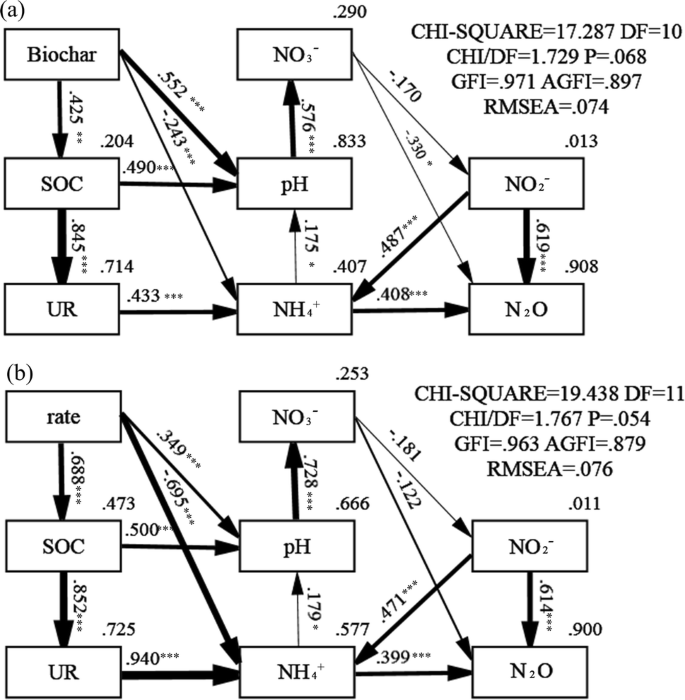
Structural equation model (SEM) diagram showing the potential causal pathways of biochar type (a) and application rate (b) on soil properties and N2O emission. The thickness of arrow represents the strength of the relationship between variables. The values associated with arrows are standardized pathway coefficients, and positive or negative numbers indicating the positive or negative relationships. Values in top right corner of box (endogenous variables) indicate the fraction be explained by the model.
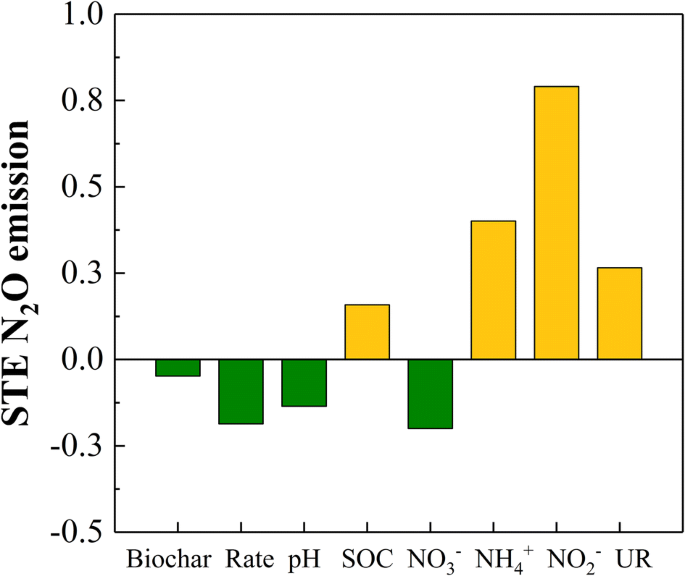
Standardized total effects (direct and indirect effects derived from the structural equation) of N2O emission.
Source: Ecology - nature.com

