Sample collection
We collected samples from three cheetah located in India, two historic and one modern. The first historic sample, here identified as Ind1, came from the mammal gallery of the Zoological Survey of India (ZSI), Kolkata (Reg. No# 7611). This individual is believed to have been shot in Madhya Pradesh in the early 19th Century, and the skin was purchased from R. Ward & Co. and added to the gallery of the Indian Museum in Kolkata on 14.11.1996. Subsequently, this specimen was moved to the mammal gallery of ZSI, Kolkata. The second historic cheetah, here identified as Ind2, was a bone sample contributed by the Mysore Natural History Museum, and dates to 1850–1900. The modern sample, Ind3, was derived from excess blood gathered as part of a routine clinical examination and contributed in 2017 by the Nehru Zoological Park, Hyderabad, to CSIR-CCMB (MOU ref. 1145/2016/A6).
Genetic sequencing
Ancient DNA (aDNA) extractions were performed in specialist aDNA-only facilities (positive pressure; physical separation of gowning, DNA extraction and library preparation rooms; regular decontamination) at the Centre for Cellular and Molecular Biology, Hyderabad. All post-PCR experiments were carried out at the modern DNA labs which are geographically distant from the aDNA facilities. Ancient DNA extraction followed a standard protocol18, using extraction buffer consisting of EDTA and Proteinase K for the digestion of skin sample (slightly modified, such that 20 mg/ml of Proteinase K was used rather than 10 mg/ml). Overnight incubation and complete digestion with the extraction buffer was followed by binding DNA to silica beads and DNA purification using guanidium thiocynate. DNA quantification of the extract was carried out using a Qubit fluorometer with concentrations in the range 100–150 pg/ml. Multiplex PCR was carried out using 2 ml of the ancient DNA extracts in a final volume of 20 ml PCR cocktails.
DNA extraction from the modern cheetah sample was completed using QIAamp DNA Blood Mini Kit (Qiagen), following the manufacturer’s protocol, in a separated modern DNA facility.
All DNA extracts (modern and ancient DNA) were quantified using Qubit fluorometer (Invitrogen, USA). The amplification products of long-range PCR were visualized on 2% agarose gel electrophoresis). Concentration and fragment size of the long-range PCR products were interpreted using quantitative ladders.
Due to the limited amount of DNA available and the historic origin of two of the samples we used multiple sequencing approaches.
Sequencing the two historic samples, Ind1 and Ind2
We first designed multiplex primers to amplify up to 8 kb of the A. j. jubatus reference mitochondrial genome (GenBank accession NC_005212), consisting of three multiplex reactions having 35, 34 and 26 amplicons targeting the coding and HVS regions of the mtDNA. After initial experiments, 41 primers were found to amplify consistently (average amplicon size 82 bp; see Supplementary Information Table S4), and were used in a single multiplex PCR reaction for each sample.
Multiplex PCRs were performed using Taq polymerase from the Sequenom MassARRAY system (San Diego, CA) kit which is designed for mass array-based genotyping. Amplification was carried out in 50 µl reactions following the manufacturer’s instructions, using 2 ng of DNA and 100 µM of each primer. Multiplex PCRs were performed on a GeneAmp 9700 thermal cycler (Applied Biosystems) with the following PCR conditions: initial denaturation at 94 °C for 15 min for hot start, followed by 45 cycles of denaturation at 94 °C for 20 sec, annealing at 56 °C for 30 sec, extension at 72 °C for 1 min, and a final extension at 72 °C for 3 min. After the multiplex PCR reaction, the products were treated with shrimp alkaline phosphatase (SAP, Amersham, Freiburg, Germany) to dephosphorylate left over dNTPs. The reaction conditions were: 37 °C for 20 minutes to remove remaining dNTPs, followed by 85 °C for 30 minutes to inactivate SAP and final incubation at 4 °C until the plate was removed from the thermal cycler. After SAP treatment, PCR products were cleaned using MinElute PCR purification kit (Qiagen).
We performed Next Generation Sequencing (NGS) using multiplex PCR products using the Ion Torrent Personal Genome Machine (PGM) platform (and confirmed SNPs using Sanger sequencing, see below). We sequenced the pooled amplicons directly, without fragmentation and blunt-ended conversion, using the Ion Plus Fragment Library Kit.
The DNA was ligated to Ion-compatible barcode adapters (Ion Xpress Barcode Adapters Kits), followed by nick-repair to complete the linkage between adapters and DNA inserts and purification. The adapter-ligated libraries were then size-selected for optimum read length (E-Gel SizeSelect). The DNA libraries were purified with freshly prepared 70% ethanol and each barcoded library was analysed using a Bioanalyzer (Agilent High Sensitivity DNA Kit) to assess individual barcoded library size distribution and determine the molar concentration in pmol/L of each barcoded library, followed by sequencing on the PGM platform.
To validate SNPs and extend sequence coverage we additionally performed Sanger sequencing, either directly on the multiplexed fragments (for the Ind2 sample, which yielded higher-quality NGS data) or after cloning (for Ind1). For Ind1, we cloned the multiplex PCR products using blunt-ended PCR cloning kits (GE Healthcare, USA), which contain pMOSBlue dephosphorylated blunt end vector. Transformation was carried out using DH5 competent cells, as per the manufacturer guidelines. Transformed cells containing insert PCR products from each multiplex PCR pool was screened using blue-white selection of colonies. We picked up approximately 1000 white colonies, isolated plasmid DNA using plasmid isolation kit (Qiagen), and then sequenced (Sanger sequencing) using universal M13 primers. The Sanger sequencing was done using BigDye terminator cycle sequencing kit V3 (Applied Biosystems, USA). After the sequencing reaction, fragments were precipitated with 5 M sodium acetate and ethanol, washed twice with 70% alcohol, dried, dissolved in Hi-Di formamide, and sequenced using an ABI 3730 Genetic Analyzer (Applied Biosystems, Foster City, USA). Sequences were edited and assembled using Sequence Analysis and AutoAssembler software (Applied Biosystems, Foster City, USA), respectively.
Sequencing the modern cheetah sample, Ind3
To sequence Ind3, we first performed long-range PCR followed by NGS of the full mtDNA. As an additional check, we also preformed amplicon NGS as described above, allowing us to validate SNPs in the sequenced region.
We collected 2 ml of blood from Ind3 and isolated DNA using a phenol-chloroform extraction. DNA was quantified using 0.8% agarose gel and Qubit 4 Fluorometer (Thermo Fisher Scientific, USA). 150 ng of DNA was used for the long-range PCR, using primers designed with Primer3Plus software19. Four pairs of oligos were used to amplify the complete mtDNA (primers and annealing temperatures are given in Table S2). QIAGEN Long Range PCR (cat. No. 206401) Kit was used to amplify the complete mtDNA genome, with 35-cycles of amplification yielding satisfactory results. PCR purification was done using QiAquick gel extraction kit, QIAGEN (Cat. No. 28704). We mixed the long-range PCR products in equimolar concentration, using a total of 1 mg of DNA for NGS library preparation. We fragmented the amplicons to 200 bp using Ion Shear Plus Enzyme Mix, and performed NGS sequencing on the Ion Torrent PGM platform as above. We obtained 600MB data with 2 million reads from the sequencing run.
Bioinformatics and analyses
The three mitogenomes were reconstructed using next generation sequence (IonTorrent PGM), followed by validation of SNPs by various methods (see above). After exploring data quality using FastQC v0.11.520, we used a custom script to drop unterminated reads and remove adaptors and primers. We then used Trimmomatic v0.3421 to trim low-quality reads (LEADING:20 TRAILING:20 SLIDINGWINDOW:4:15 MINLEN:18). We then aligned reads to the A. j. jubatus mtDNA reference sequence (NC_005212) using Bowtie 2.022 and end-to-end alignment and the -very-sensitive flag. After converting to.bam format using samtools23 we proceeded with SNP calling using GATK v3.7-0gcfedb6724. We applied base recalibration using a manually generated set of reference SNPs based on published cheetah mtDNA (for a list of samples used see Table S1) before SNP calling using default parameter settings. We hard filtered SNP calls (DP < 10 || QD < 5.0 || FS > 10.0 || MQ < 20.0 || ReadPosRankSum <−8.0). A small number of SNPs were found to be heterozygous calls; these potentially reflect heteroplasmy, DNA damage or limited incorporation of numt sequence (common in Felidae, e.g.25, which can lead to chimeric reconstructions of nuclear and mitochondrial sequence and confound phylogenetic analysis). These were excluded unless they could be confirmed via a cloning experiment (two cases, see below). Sequence with read depth <10 was recorded as missing data in the analysis. As the mtDNA is relatively short, we were able to manually check called SNPs against the aligned reads using Tablet v1.16.09.0626, confirming that all called SNPs had considerable support.
To confirm the absence of numts in our sequence data, we followed Li et al.27 in plotting the rate of mismatch of newly generated sequences against high-quality published mtDNA data (here, the cheetah mtDNA reference sequence NC_005212, confirmed by Li et al. to be free from numts). We additionally plotted the mismatch rate of the Puma concolor mtDNA reference sequence NC_016470, thought to incorporate a numt spanning the 12 S and 16 S genes27, against a high quality Puma concolor sequence (KP202261) as an example of the pattern expected when numts are incorporated into mtDNA data. This analysis, shown in Fig. S1, was conducted using a sliding 1000 bp window (values are not shown if <200 bp of the window was called), and confirms that our approach to SNP calling was effective in avoiding numts.
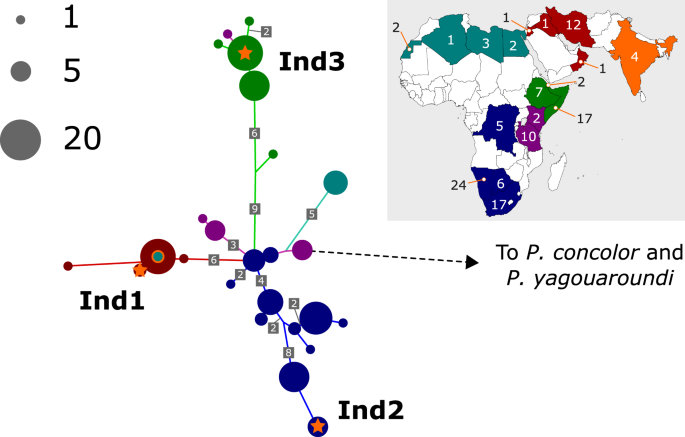
To locate the Indian cheetah mtDNA in the context of worldwide diversity we built a comparative dataset using published cheetah mtDNA data9,27,28,29 along with puma (Puma concolor) and jaguarundi (Puma (Herpailurus) yagouaroundi) mtDNA to provide an outgroup clade (see Table S1). This dataset yielded an alignment derived from both the mtDNA coding (ND5 and Cytochrome B) and control regions, concatenating to a length of 1238 bp; sequences from different data sources had different gaps in this alignment. It was possible to use the Puma concolor mtDNA reference sequence NC_016470 for this analysis as numts were not incorporated into these genes27. The dataset was aligned using a MAAFT online server30 and a consensus maximum likelihood phylogenetic tree was generated using IQTree online server model selection (supporting a TN + I model by Bayesian Information Criterion) and tree building methods31. We inferred probable mutations on the tree using the IQTree ancestral sequence reconstruction option (-asr) to infer the most likely sequence at each internal node. The location of the three Indian samples on this unrooted tree is indicated in the Fig. 1 schematic, where highly similar samples have been collapsed to aid visualisation.
To determine divergence dates between the mtDNA of cheetah subspecies, we constructed a maximum likelihood tree based on the coding region of available cheetah full mtDNA sequences, our Indian samples, and an outgroup consisting of puma (Puma concolor, KP202261) and jaguarundi (Puma (Herpailurus) yagouaroundi, NC_028311) mtDNA. As before, the IQTree web server was used to build a tree topology, this time using the TN + G5 model (the most strongly supported commonly implemented substitution model by BIC). We used PAML 4.732 to retrieve likelihoods for a likelihood-ratio test of the molecular clock, and were unable to reject the null hypothesis that the rate of evolution is homogenous among all branches in the phylogeny (no clock log-likelihood = −29341.106115; strict clock log-likelihood = −29345.873227; p-value with 5 degrees of freedom = 0.09). The output tree from the strict clock model is shown in Fig. 2. The tree was scaled following Charruau et al.9, using a divergence date between the puma lineage and cheetah of 4.92 million years13.
As there were only seven branches in our divergence-dating dataset we were able to explicitly compare and assign probabilities to all possible tree topologies. We sought to retrieve as accurate as possible an estimate of divergence dates and topology support. All possible topologies were generated using a custom Python script (www.github.com/guysjacobs/cheetahtree) and used as input into IQTree. We used the bootstrap proportion using resampling estimated log-likelihoods method (bp-RELL33), to assign posterior weights to each topology, and retrieved the top 10 topologies which together accounted for 93.2% of the posterior weight. We used PAML to retrieve branch lengths from each tree. We then calculated the mutation rate separately for each tree topology, this time using the root height (and root height standard error, assuming a normal distribution of root height uncertainty) and a calibration distribution of the puma-cheetah divergence specifically, a skew-normal distribution fitted to the 4.92 my date and 3.86–6.92 my confidence intervals given in Johnson et al.13 using scipy.stats34. We multiplied the pdfs of these distributions to obtain relative probabilities of combinations of root height and puma-cheetah divergence, calculated the mutation rate implied by each combination of root height and puma-cheetah divergence, and, by weighting mutation rate by probability, obtain a distribution of mutation rate that takes into account both tree height uncertainty and uncertainty in the puma-cheetah divergence date. The mutation rate distribution based on each tree topology was used to convert branch lengths into date distributions. By weighting the divergence dates implied by each tree according to that tree topology’s bp-RELL posterior weight we obtained distributions of dates that take into account uncertainty in tree depth, the puma-cheetah divergence calibration point, and tree topology (Fig. 3); and by comparing the topology of trees we can calculate overall support for different evolutionary relationships in our data.
As an additional check on the divergence dates inferred by maximum likelihood, we conducted a Bayesian phylogenetic analysis using BEAST v2.4.814. We used the same coding region alignment as in the maximum likelihood analysis above. As our data incorporated multiple species (puma, jaguarundi, cheetah subspecies) we used the starbeast2 package35. The xml file is available as Supplementary File S1. We used the Tamura-Nei mutation model with 5 Gamma rate categories, with a strict clock model, a birth-death tree prior and constant population sizes. Priors were left as default, with the exception of the strictClockRate (LogNormal with mean in real space = 1.0 and standard deviation 3.0) and constPopMean (LogNormal with mean = 1.0 and standard deviation 3.0). Calibration was achieved by fixing a prior on the species tree root (LogNormal with mean = 0.82 and standard deviation 0.33, and offset 2.65) that closely approximates the puma-cheetah divergence date distribution (4.92 mya, 95% CI = 3.86–6.92) suggested by Johnson et al.13. The MCMC chain length was set to 1e8, sampling every 20000 steps, and all effective sample sizes were over 500. As further checks on our BEAST results we both sampled directly from the priors (leading to extremely different posterior parameter estimates and hence confirming that the data drives model inference) and confirmed that using alternative models did not substantially impact estimated divergence times (Yule tree prior and/or a linear with constant root population sizes). The BEAST analysis confirmed the maximum likelihood tree topology (Fig. 2A).
To more accurately estimate cheetah subspecies divergence we modified the BEAST analysis to include the full dataset of published shorter mtDNA fragments (Table S1). The mixed nature of this dataset (with single species represented by both modern and historical samples) meant that it was not possible to directly model the ages of samples in the analysis, and all samples were assumed by the model to represent modern individuals. However, this will not greatly distort results as the age of most samples (<200 years) is a small fraction of the inferred date of the demographic events of interest (tens of thousands of years). Two somewhat older samples were included in the analysis (800–900CE, Asiatic cheetahs from Iran), but excluding these from the alignment and re-running the analysis lead to minimal changes in results (e.g. <3% difference in subspecies most recent common ancestor date estimates for Asiatic versus either Southeast or Northeast African cheetahs).
As this alignment included the D-loop region we performed the starbeast2 analysis using two partitions (coding region and D-loop) but linked trees, thus maintaining phylogenetic consistency while allowing the inference to incorporate a faster D-loop mutation rate. We excluded a repetitive region of the D-loop from this analysis (from position 257 to 594 of the cheetah mitochondrial reference sequence, NC_005212). A ‘Linear with Constant Root Populations’ model was preferred to allow for constant rate population size changes occurring over the time frame of species existence; but date estimates are robust to using different population modes (‘Constant Populations’). As above, we used the Tamura-Nei mutation model with 5 Gamma rate categories, with a strict clock model and a birth-death tree prior. Priors were set to default distributions except for the mutation rate (LogNormal with mean in real space = 1.0 and standard deviation = 3.0) and puma-cheetah divergence calibration as above. The MCMC chain length was set to 1e8, sampling every 20000 steps, and all effective sample sizes were over 500, with the TreeAnnotator v2.4.0 BEAST sub-program used to construct the maximum clade credibility tree shown in Fig. 2B. The .xml file is available as Supplementary File S2.
The reconstructed Ind1, Ind2 and Ind3 sequences are deposited on GenBank with accession numbers MK469961-3. Ion Torrent PGM output for each sequence is available from ENA (Accession ERP113364).
Source: Ecology - nature.com
