Heavy metals.
In Table 1 and Supplementary Table 1A (Appendix) the measuring results of the concentration (μg/L) of heavy metals As, Cd, Cr, Cu, Fe, Mn, Ni, Pb, Zn are shown. Actually, Table 1 represents minimum, maximum and mean values per municipality, of all measured parameters, and Supplementary Table 1A represents the average value of the triplicate measurement with relative standard deviations (RSD%) for each element form each sample. Supplementary Table 1A also presents their minimal, maximal and mean values for all samples. Negative values mean that these elements are practically non-existent (the concentration is less than 0.01 μg/L so they were not even taken into consideration, and they were treated as zero). The calculated average values differ depending on the researched measuring site of sampling.
Based on these results, it is concluded that the values of analysed contents of heavy metals in some cases exceed the values given by the EU Directive26 and related to the Policy book of the Republic of Serbia21,27 and to the Policy about the quality and other requests for natural, mineral and table water28. In the Municipality of Zvečan the value of the concentration of Pb amounts to 32.82 μg/L (sample 2) and 41.72 μg/L (sample 3), bigger than the maximally allowed concentrations (MAC) suggested by the EU (10 μg/L)26, the Republic of Serbia (10 μg/L)21,27,28 and WHO 2006 (10 μg/L)29. The increased content of lead is probably the consequence of the vicinity of the flotation tailing ponds of MMCC “Trepča” which contains the increased concentration of sulphide minerals of lead30. In the municipality of Leposavić, the value of concentration of As amounts to 33.74 μg/L (sample 6). The value of Fe is 255 μg/L (sample 7), while the value of concentration of Ni is 38.19 μg/L (sample 6). This content can be expected, as a consequence of the vicinity of the mine whose beddings contain a significant part of primary oxide minerals Fe, Pb and As and secondary minerals with a certain part of presence, such as Ni, which is in accordance with data presented in literature30,31,32. The values of the other examined elements in the municipalities of Zvečan and Leposavić were lower than the prescribed values. In the municipality of Novo Brdo the concentration of examined metals was within the prescribed values, which can be explained by the bigger distance from the tailing pond and the source of pollution. During the sampling, pH values were measured, ranging from 6.6 to 7.6, while mean value was 7.04.
Potential carcinogenic and non-carcinogenic risk assessment
Intake of toxic elements, especially their high concentration levels in drinking water, can have a harmful effect on human health.
Risk assessment, which components are the hazard and exposure, is the proceeding of evaluating the probability of any probable adverse health effects occurrence over a defined period of time. The health risk assessment of each potentially toxic metal is based on the quantification of the risk and is defined as carcinogenic (KR) or non- carcinogenic health risk (NKR). Two main toxicity risk factors for risk estimating are the slope factor (SF) for carcinogen risk and the reference dose (RfD) for non-carcinogen risk33. A slope factor SF is an upper bound on the increased cancer risk from a lifetime exposure to an agent by ingestion. Reference dose (RfD) is an estimate of a daily oral exposure to the human population that is likely to be without an appreciable risk of deleterious effects during a lifetime.
Risk characterization is the final step of health risk assessment, after hazard identification, hazard characterization, and exposure assessment. The health risk from groundwater consumption was assessed in relation to its non-carcinogenic as well as carcinogenic effects.
Potential non-carcinogenic risk from oral consumption (NKRORAL) assessment can be determined using the following formula34:
$$ {text{NKR}}_{{{text{ORAL}}}} = { }frac{{{text{U}}_{{{text{ORAL}}}} }}{{{text{R}}_{{text{f}}} {text{D}}}},,, {text{where is}},, {text{U}}_{{{text{ORAL}}}} = { }frac{{{text{PPV }} cdot {text{c }}}}{{text{PTM }}} $$
(1)
where PPV is the average water consumption per capita, 2 L daily; c is the concentration of elements included in the study (mg/L); PTM is the average weight of an adult consumer – 75.65 kg (based on available data from relevant medical institutions in Leposavić, Zvečan and Novo Brdo); RfD is the reference value for the intake of toxic elements (mg/kg/day), recommended by USEPA34; period of consumption is estimated at 365 days a year and exposure at 30 years; average exposure period is 10,950 days.
The carcinogenic risk from oral consumption (KRORAL) for As, Pb, Cr, Cd and Ni (because of their potential long-term impact on human health) was calculated as the product of UORAL (mg/kg-day) times the SF (mg/kg/day)−1.
RfD and SF values for heavy metals are presented in Table 2.
An acceptable level (that can be tolerated) of NKRORAL is ≤ 1, and of KRORAL is 1 × 10⁻⁴–1 × 10–633
Arsenic has both carcinogenic and non-carcinogenic human health effect, so it is analysed from both points of view.
Results of UORAL, NKRORAL and KRORAL are given in Tables 1 (min, max and mean values per municipalities), Supplementary Table 2A (Appendix), Supplementary Table 3A (Appendix) and Supplementary Table 4A (Appendix), respectively.
UORAL values range from 0 to 0.00677 mg/kg/day. Based on these values, NKRORAL and KRORAL were calculated at all 15 measuring sites.
NKRORAL values range from 0 to 2.973. The maximum value (2.973) refers to As at sample 6 and it can be confirmed that this element poses a significant carcinogenic risk.
The values for KRORAL give a completely different picture. For As, it ranges from 0 to 0.0013. Arsenic poses a significant carcinogenic risk to the health of residents. The most threatened sample is 6, followed by 10, 14 and 13, marked in bold (Supplementary Table 4A). Values of parameters with acceptable risk are marked in italic bold (Supplementary Table 4A).
Radon
Since the concentration of radon in water could not be measured at the sampling site in Table 1 shows corrected value of radon concentration Ccorr determined by the formula22:
$$ {text{C}}_{{{text{corr}}}} = {text{ C}}_{{text{o}}} cdotdelta , $$
(2)
where δ = eλt, radon decay λ = 0.00756 h−1 and Co (Bq/L) value was measured in the laboratory after several days and t defines time elapsed from sampling to the laboratory analysis. Water temperature, effective dose from ingestion Eing and effective dose from inhalation Einh are also the parameters presented in Table 1 (min, max and mean values per municipalities) and Supplementary Table 5A.
Carcinogenic effect of radon, in the long-term sense, refers to determining the total effective dose of internal radon radiation dissolved in water, which consists of two components: the first one being defined by the effective dose from ingestion, whereas the second one being defined by the effective dose from inhalation. Radon-rich water goes directly to the stomach, wherefrom radon could penetrate through the stomach walls into the body. One part of the radionuclides could stay at the same place for a long time, while others could bind to macrophages and then be transferred to lymph cells. These cells can receive radiation doses of alpha particles emitted by the decay of radon and its short-lived progeny in the stomach walls35. Effective dose from ingestion of radon and its progeny relates to gastric tissue, expressed in mSv/y is determined in the following way:
$$ {text{E}}_{{{text{ing}}}} = {text{ K }} times {text{ C}}_{{{text{Rn}}}} times {text{ KM }} times {text{ t}} $$
(3)
where K is the conversion factor of 10–8 Sv/Bq for adults; CRn is radon concentration in water (Bq/L); KM is the consumption factor (optimally 2 L/day) 36 and t period of 365 days37.
It is known that radon leaves the water very quickly and thus increases its presence in indoor air22. Since the spring water is used by the population for drinking and other household purposes, the effective dose of inhalation was determined as followed: 1 Bq/m3 radon in air38, with equilibrium factor 0.4 and occupation factor of 0.8 gives an effective dose to the lung of 25 µSv/y. Assuming that the ratio of radon concentration released from water into air and a radon concentration in water equal to 10–4, the conversion factor from unit concentration from radon et equilibrium is 2.8 µSv/Bq m338.
The results indicate that in the sampled spring waters radon concentration ranges from 0.34 ± 0.12 Bq/L (sample 8) to 341 ± 35 Bq/L (sample 11), with a mean value of 36.44 Bq/L, which is below the reference level of 100 Bq/L37,39. This somewhat higher radon concentration is a consequence of the geological structure of the Zvečan municipality’s terrain; the structure of the northeastern terrain is dominant in Paleozoic shales (samples 2 and 3) whereas the western part of the terrain is characterized by igneous rocks (sample 1)20. Radon concentration in water sampled at sites 4, 5 and 6 in the municipality of Leposavić is higher than samples from sites 7, 8, and 9. That is a result of the geological structure of the terrain itself, where Neogene sediments and magmatic rocks prevail20. In the area of the municipality of Novo Brdo, exceptionally high radon concentration in the water 341 ± 35 Bq/L (sample 11) was measured at only one site, while at others radon levels were low. This high radon concentration is a consequence of the geological structure of the terrain where the spring is located. Although the total area of the municipality of Novo Brdo is abundant with magmatic rocks, granite and marble, the terrain’s geological structure at the actual source is dominant with quartz, marble and granitic rocks of different metamorphic origin40. If the mean value of radon concentration presented in this paper is compared with the data from literature41,42,43,44,45 it can be seen to be slightly higher. This can be justified by the geological structure of the terrain.
Temperature ranges from 11 ℃ (sample 12) to 17 ℃ (sample 6), with a mean value of 14.6 ℃, which puts them into the group of cold ground waters22.
The value of effective dose from ingestion ranges from 2 μSv/y (sample 8) to 2,500 μSv/y (sample 11), with a mean value of 260 μSv/y, which is above the recommended value of 100 μSv/y40. It could be argued that, from a radiological aspect, the water from all springs, except for the one from the village of Vlasce in the municipality of Novo Brdo (sample 11), is wholesome and can be used for drinking as well as other purposes. Regarding the radiation dose from radon inhalation, it mainly derives from the short-lived radon progeny settled in bronchi since most radon is expelled by exhaling. The effective dose from inhalation ranges from the minimal value of 0.9 μSv/y (sample 8) to 954 μSv/y (sample 11), with a mean value of 101.8 μSv/y.
Statistical analyses
The correlation of measured parameters: heavy metals, radon in water and pH level in water defines the value of Pearson’s correlation coefficient—r, which is presented in Table 3.
The most evident is the correlation of iron and copper—0.948, then copper and manganese. There is also a positive correlation between manganese with cadmium—0.640 and iron—0.769. The values of correlation coefficient of lead with iron and copper of 0.520 and 0.586, respectively, are another indicator of their common origin. As regards the correlation between radon and heavy elements, the correlation between radon and chromium—0.827 and manganese 0.827 singles out. The data from Table 3 indicates that the pH values of the investigated samples do not have any significant impact on the measured values of the present elements of heavy metals and radon, although a certain correlation of pH values and lead—0.323 and iron—0.242 could be argued. Based on the small values of the correlation coefficients obtained for some of examined elements, it can be concluded that they are of natural origin.
Concentrations of the investigated elements of heavy metals and radon compared to MAC and in accordance with Policies20,26,27,37 at all measuring sites (1–15) at the investigated locations are shown in Fig. 2.
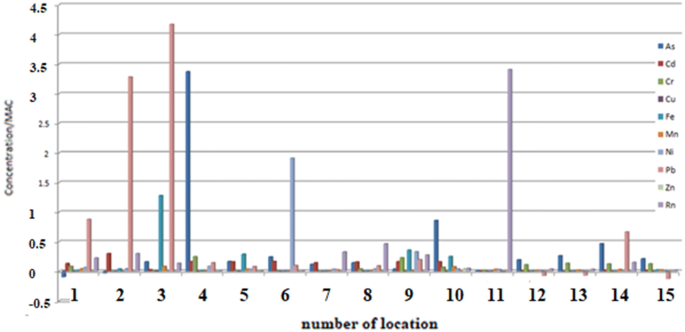
Concentrations of heavy metals and radon compared to MAC and in accordance with EU, WHO and the Republic of Serbia’s policies in sampled natural spring waters at 15 measuring sites.
From the Fig. 2 it can be seen how many times each individual element increases concentration over the recommended value. Thus, Pb in sample 2 has 3.2 times higher concentracion and sample 3 has four times higher concentracion than the recommended value of 10 μg/L. In sample 4 Ni is almost two times higher than the recommended value of 20 μg/L. In sample 6 As stands out in enhanced concentration, it has as much as 3.3 times higher concentration than the recommended − 10 μg/L. In sample 11, the pronounced concentration of Rn is 3.5 times higher than the recommended value of 100 Bq/L. Concentrations of other tested elements at all 15 selected measuring sites do not deviate significantly from the recommended one, or are found in traces, so their relationships should not be commented.
Figure 3 shows the results of the multivariate cluster analysis as a dendrogram. According to the results, the primary clusters of heavy metals As–Cr and Cu–Mn–Cd indicate the common origin of the minerals: the first from mining activities in vicinity of springs, and second from inustry, both indicate anthropogenic impact.
Figure 4 shows the spatial distribution of each heavy metal and Rn.
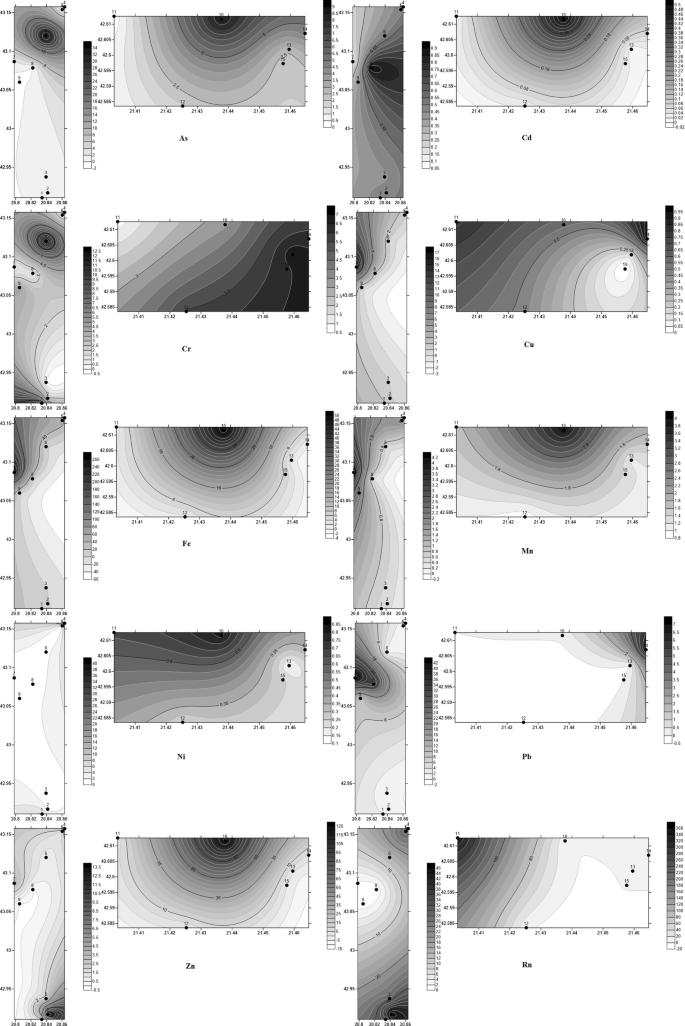
Spatial distribution of heavy metals and radon (heavy metals in μg/L and Rn in Bq/L) (Golden Software Surfer12 https://www.goldensoftware.com/products/surfer).
Principal component analysis (PCA), mathematical tool used to reduce the number of variables while retaining the original variability of the data, was performed to explain the cause, that is, to define the dominant factor affecting the measured concentrations of heavy metals in the water samples at all measuring sites. It can be noticed, already on the basis of correlations, and then from PCA results, that at all measuring points Cu, Fe, Pb and Mn are consequences of the same pollution factor (mining), while Cr and As are the consequence of some other source of pollution (industry). Other four elements are consequences of other four different factors (Table 4). Negative values occur in variables that are inversely related.
Source: Ecology - nature.com
