Setting
The trial was conducted in Eastern Province, Zambia during the 2017 spray season (October to December 2017). Six largely rural districts in Eastern Province were included in the trial (Fig. 1). In these districts, Anopheles funestus and An. gambiae are the primary malaria vectors. Insecticide resistance to pyrethroids is widespread, and resistance to dicholorodiphenyltrichloroethane (DDT) and carbamates has been detected19. Malaria parasite prevalence has decreased in Eastern Province over the last 10 years, from 21% during the 2006 Malaria Indicator Survey (MIS)20 to 13% during the 2015 MIS21. ITNs are the primary vector control strategy and coverage of at least one ITN per household in Eastern Province was found to be less than 70% during MIS of 2008, 2010, 2012, and then at 93.8% in 201521,22,23,24. IRS by government campaigns was first introduced in 2009, with 14% of houses in Eastern Province sprayed according to the 2010 MIS23 and 54.6% of houses sprayed according to the 2015 MIS21. In 2014 IRS operations began broadly using the organophosphate insecticide pirimiphos-methyl (Actellic®300CS, Syngenta). In Zambia, malaria testing and treatment at public health facilities is free for anyone attending. From surveys, others have estimated that nationwide approximately half of children with a fever will seek treatment from a health center where an estimated 70% of them receive a laboratory test for a malaria infection25.
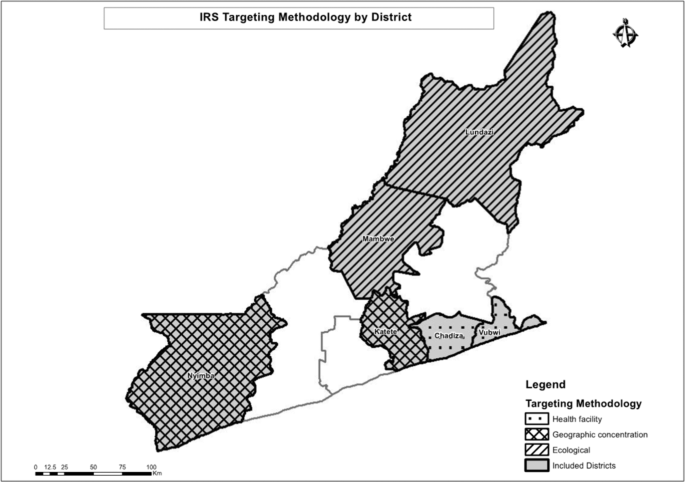
A map of the study area showing the allocation of different spray strategies.
Study design
We compared outcomes of three different IRS prioritization strategies (described hereafter) using differences-in-differences comparison. Confirmed malaria incidence at the health center and reported to the health management information system (HMIS) served as the primary outcome and was available both before and after 2017 IRS operations. Entomological collections were conducted in the intervention arms after IRS implementation in 2017 and allowed for a post-only comparison.
Indoor residual spraying
IRS was implemented in the study districts with funding from the President’s Malaria Initiative (PMI) and in accordance with the Zambian Ministry of Health/National Malaria Elimination Program and PMI Africa Indoor Residual Spraying (AIRS) program standards supplemented with mSpray, which is described in detail elsewhere17,26,27,28. IRS was conducted using pirimiphos-methyl (Actellic 300 CS). The funding for spray operations was independent of the trial; study investigators only served in an advisory capacity to actual implementation of the intervention. IRS in Eastern Province was implemented during November and December 2017, the months preceding heavy rains. According to MIS data previous campaigns have covered around 50% of total structures within Eastern Province (with higher coverage of structures targeted), and we expected a similar level of coverage within trial districts.
IRS targeting
Three different spray allocation strategies were deployed through the trial: sub-geographic concentration (comparison arm), health facility targeting, and ecological targeting (Fig. 2).
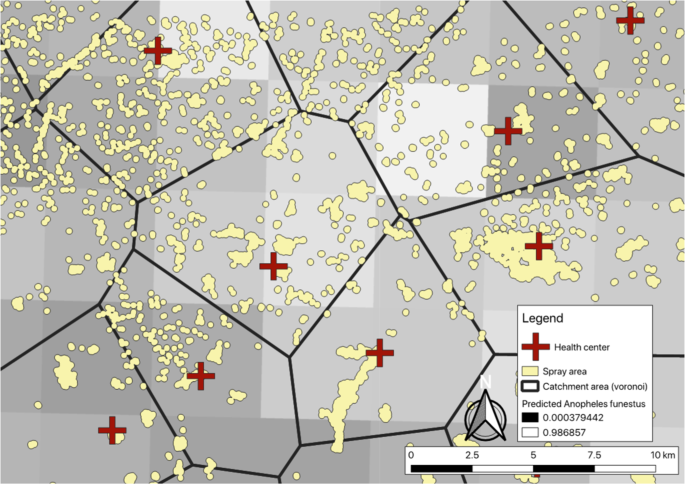
Zoom-level view of communities and different IRS allocation strategies. When allocating based on health facility-level incidence, communities within catchment areas would be sprayed or not, depending on the numbers of cases per the nearest health center. When allocating based on predicted An. funestus habitat, communities within lighter squares would be sprayed or not. Sub-geographic concentration would be to spray all communities within an arbitrary boundary.
Sub-geographic concentration – comparison arm
In the comparison arm, IRS was implemented in a fashion similar to many implementations across Africa, where the goal is to achieve heavy saturation or “blanket spraying” of IRS within a defined geographic area, often an administrative unit. In Zambia, unlike the majority of PMI-supported countries, all districts receive some amount of resources for spraying and withdrawing spray operations from one district to concentrate resources in another district was not feasible. Instead, to simulate a blanketed geographic area, we utilized a circular window within each district, beginning at the geographic center of the district and sprayed expanding outward until exhausting available operational funds.
Health facility targeting
Within the health-facility targeting arm of the trial, the decision where to apply IRS within a district was determined based on reported health facility malaria incidence in the HMIS over the previous two years (2016 and 2017 malaria transmission seasons) as detailed elsewhere17. Communities within a district were assigned to the nearest health center using Euclidean or linear distance, and a measure of malaria incidence was estimate for each community. Those with the highest estimated malaria incidence were prioritized for IRS. We selected Chadiza and Vubwi Districts into this arm due to them having the greatest variance in our measure of incidence of the six districts included in the trial.
Ecological targeting
In the ecological-focused arm of the trial, IRS was allocated based on predicted probability of An. funestus as developed by the Malaria Atlas Project (MAP)29. The median predicted probability of An. funestus for each community was extracted from the MAP estimates and used to prioritize communities for IRS. We selected Lundazi and Mambwe Districts into this arm due to them having the greatest variance in the measure of predicted An. funestus populations of the six districts included in the trial.
Data collection and procedures
HMIS data
Monthly HMIS data, January 2014-May 2018, and by health facility, were retrieved from the DHIS2 for all of Eastern Province in August of 2018. Specific indicators used included laboratory-confirmed malaria cases (the majority of which are by rapid diagnostic test [RDT]), number of malaria tests conducted, monthly outpatient attendance, and annual health facility catchment area population.
Entomological data
Five CDC light traps were deployed monthly from December 2017 to April 2018 in each of the 25 villages purposefully selected by size (small and large) and spray status (sprayed or unsprayed) for entomological surveillance (5 villages per intervention district, excluding Katete which has ongoing entomological surveillance as part of AIRS operations). Five houses within each selected village were selected purposefully to ensure broad geographic coverage throughout the selected village. These houses then hosted the CDC light traps once a month for the duration of the entomological surveillance. Characteristics of participating households were collected, such as structure type, vector control interventions available, and occupancy. Additionally, indoor resting mosquitoes were collected using the Prokopack handheld aspirator (Emory University, Atlanta, Georgia) in two houses per village30. Aspirator collections commenced at 05:00am. Indoor walls, ceilings, the undersides of furniture, and hanging clothes were systematically aspirated using progressive down- and upward movements along their entire surface with a speed approximating 1 meter per second.
Traps and aspirator collections were processed within survey areas. Mosquitoes from both collection types were geo-referenced to the household in which they were collected and morphologically assigned to genus level and separated by sex. Samples were stored dry on silica and taken to Macha Research Trust, Choma District where they were morphologically assigned to species or species complex level using standard keys31,32, and then confirmed to species using PCR when appropriate.
Environmental data
We obtained estimates of environmental factors included in the adjusted analyses from Google Earth Engine. We retrieved normalized digital vegetation index (NDVI) from the Landsat Tier 1 8-day NDVI collection and aggregated to month (median) within Google Earth Engine. We retrieved precipitation from the Climate Hazards Group InfraRed Precipitation with Station data collection33 and aggregated to month (sum) within Google Earth engine. We retrieved yearly nighttime lights from the Visible Infrared Imaging Radiometer Suite34. And we retrieved elevation from a digital elevation model (DEM) created with the ASTER projection. We linked environmental values to each health facility in the HMIS using the Raster package35,36 in R version 3.5.137. Health facility locations were buffered by 5,000 m and mean values of each raster within the buffer were assigned to each health facility. In cases of missing NDVI data due to high cloud cover, we used linear interpolation between nearest time points to impute data. For health facilities without geocoordinates (15%) we assumed the median value within the district of each environmental measure (monthly for NDVI and precipitation and yearly for nighttime lights).
ITN coverage
Information about ITN ownership was extracted from the 2018 Zambia MIS, which took place April–May 2018. The MIS over-sampled in Eastern Province by approximately 350 additional houses from both sprayed and unsprayed locations; which enabled a detection of 10-20% difference in ITN coverage in sprayed versus non-sprayed areas and between study arms.
Sample size and statistical power for HMIS analysis
Data from all health centers in the six trial districts were included in the analyses of HMIS data. The primary outcome of confirmed malaria incidence allows for the estimation of power using formula provided by Hayes and Bennett38. The sample size calculations are based on the following parameters: 1) probability of committing a type-1 error of 5% (two-sided); 2) 80% statistical power to detect a difference in confirmed malaria incidence between trial arms, 3) an estimated catchment area population per health center of 10,000, 4) an estimated 3 malaria cases per person per year, and 4) a coefficient of variation between health facilities of 0.5. With these parameters, a minimum of 55 health centers per trial arm needed to be included to observe a 25% decrease in confirmed malaria incidence. Following the trial we conducted a post-hoc analysis of the coefficient of variation between health facilities within each trial arm.
Analysis
HMIS data
We used a generalized linear model with the health center as a random intercept and a negative binomial link due to overdispersion in a difference-in-differences approach to assess the effect of different IRS targeting schemes on confirmed monthly malaria incidence. In the analysis we included the trial arm by time (pre- and post-) interaction and the health center population as the offset. We tested how well continuous environmental measures fit the data compared to those same measures categorized into quintiles using Aikake’s Information Criteria. We then adjusted with the following covariates: type of health facility (categorized into health post, health center, or hospital), NDVI lagged one month (categorized into quintiles), precipitation lagged one month (categorized into quintiles), yearly nighttime lights (continuous), altitude (categorized into quintiles), confirmed monthly malaria cases lagged one month, the number of confirmation tests performed that month (either RDT or microscopy), a continuous variable for time, and a Fourier term of time to account for seasonality39.
Entomological data
We used a generalized linear model with the data collection village as a random intercept and a negative binomial link due to overdispersion to model the total number of female Anopheles mosquitoes found at a household for each night of surveillance. In the analysis we included whether the village was sprayed or unsprayed, and tested for an interaction between receiving IRS and trial arm. We then adjusted for the following covariates: type of eaves (open or closed), ITN in the household (at least one hanging or not), type of collection method (light trap or prokopack), NDVI lagged one month (continuous), precipitation lagged one month (continuous), night light in 2018 (continuous), altitude (continuous), and month of the year (categorical).
Ethics approval and consent to participate
This trial was reviewed and approved by the National Health Research Science council of the Ministry of Health in Lusaka, Zambia; ERES Converge IRB in Lusaka, Zambia (protocol #2017-Apr-004); and Syracuse University IRB in New York, USA (protocol #17-074). The United States Centers for Disease Control and Prevention reviewed and approved the protocol under Cat IIIB (CGH tracking #2017-241). Study methods were performed in accordance with the guidelines and regulations stipulated by these institutions and informed consent was obtained for all human data collections.
Source: Ecology - nature.com

