Raw datasets and pre-assembly processing quality control
The sequencing process generated a total of 88,4 M in TTR, 87,8 M in SSC, 80,2 M in TLU and 84 M in MPO paired-end raw reads. All raw datasets were initially scrutinized by the FastQC tool, trimmed with Trimmomatic, error-corrected with Rcorrector and decontaminated with Centrifuge software. The percentage of removed reads per step in the pre-assembly processing stage can be visualized in Table 2. Overall, ~86,7 M in TTR, 87,1 in SSC, 79,2 in TLU and 82,8 MPO reads had Phred scores higher than 20 and were retained for the transcriptome assembly stage (Table 2 and Fig. 2a–d 33).
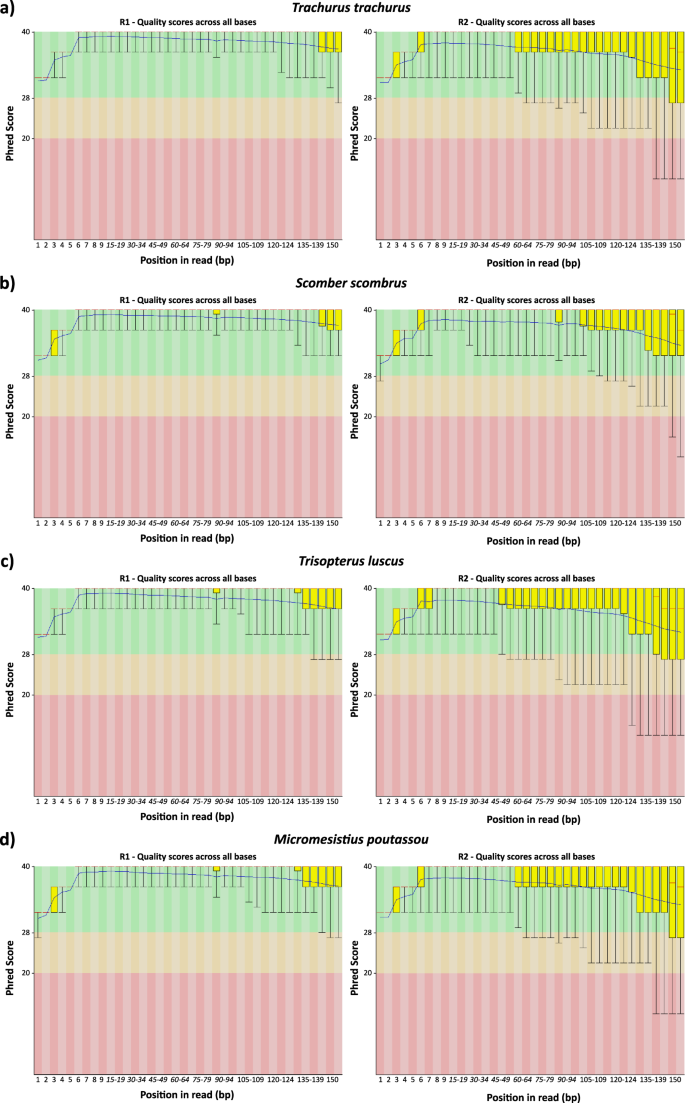
Quality FastQC report of post-processing RNA-seq datasets (after Centrifuge (version 1.0.3-beta)16 cleaning stage). For each species, it is presented the R1 and R2 FastQC reports. (a) Trachurus trachurus; (b) Scomber scombrus; (c) Trisopterus luscu; (d) Micromesistius poutassou.
Transcriptome assembly metrics
The de novo transcriptome assembly was performed using multiple software including Trinity, rnaSPAdes, SOAPdenovo-trans and IDBA-trans. This strategy has been previously applied with success in transcriptome projects of multiple organisms, without a reference genome39,40,41. The first assembly obtained with Trinity tool was used to map the raw decontaminated reads and to calculate the IS and SD for each species. In all species, the IS and SD values ranged between 267–280 and 59–61 (Table 2). The initial multi-assembly approach generated 64 transcriptome assemblies, 16 for each species38. The statistic metrics for each assembly, such as N50 transcript length, mean transcript length, percentage of GC, longest transcript length, or transcript number over 1k or 10k nucleotides can be visualized in Online-only Tables 1–4. In addition, we also performed BUSCO analyses using 303, 978, 2586 and 4584 near-universal single-copy orthologs in Eukaryota, Metazoa, Vertebrata, and Actinopterygii gene sets, respectively, for all the 16 assemblies (Online-only Tables 1–4). Regarding the individual assemblies, the Trinity tool presented the higher values of N50 and mean transcript length in all species: TTR – 1708 and 921,55 bp, SSC – 1964 and 984,48 bp, TLU – 1321 and 780,05 bp, and MPO – 1228 and 782.03 bp, respectively (Online-only Tables 1–4). Moreover, the BUSCO analyses revealed the same pattern with higher percentage of total genes found (complete + fragmented) in Trinity assemblies for all lineage-specific profile libraries consulted (Eukaryota, Metazoa, Vertebrata and Actinopterygii): TTR – 100.00, 99.28, 90.37, 81.72%, SSC – 99.01, 99.28, 89.29, 79.89%, TLU – 100.00, 99.80, 92.34, 83.40%, and MPO – 100.00, 99.69, 92.42, 83.99% (Online-only Tables 1–4). The magnitude of these values is comparable and, in some cases, superior to several fish transcriptomes, publicly available, e.g. (e.g. Xiphias gladius – 99 and 98.2% of genes found in Eukaryota, Metazoa databases42; Amphiprion percula – 85.4% of genes found in Actinopterygii database43), which suggests a high quality of our initial assemblies.
Post-assembly processing and annotation verification
At this stage, the 16 assemblies per species were concatenated and decontaminated, resulting in four multi-assembly transcriptomes – Online-only Table 4 38. During the decontamination phase, all blast-n results were manually inspected and the threshold of minimum alignment length of 50 bp and taxonomic superclass Actinopterygii, were specifically selected due to two factors: the considerable number of plausible biological contamination hits with more 50 bp of nucleotide alignment length (e.g. Lasthenia californica (Taxon ID: 149440)) and the relatively high number of Actinopterygii species with genome sequenced and annotated on nt-NCBI database (at least 43 species), respectively. Although, some transcripts have been discarded at this stage (e.g. novel sequences not present in this 43 Actinopterygii species), we have ensured the application of sensitive blast parameters. Thus, instead of focusing the analyses on the removal of all sequences with a match hit, we performed first an effort on the identification of the hits, via homology, against the possible sources of contamination and only after excluded if confirmed. Apart from a few transcripts that have been removed, this approach increased the confidence levels of each dataset. Posteriorly, four multi-assemblies were subject to a redundancy removal step to decrease the complexity and to remove the overlapping transcripts above 95% of sequence similarity34,35,36,37. This method has been highly used to remove redundancy in several datasets and organisms40,44,45,46, namely in the build of new transcriptomic references. In addition, this strategy still decreased the natural heterozygoty of the organisms in the assemblies. It should be noted that although naturally present in the organisms, the heterozygosity continues to be a crucial parameter to consider during the generation of transcriptomic and genomic datasets. In some cases, where heterozygosity is not contemplated in the bioinformatic approach, the results change completely and their interpretation can be affected. Using this approach, the total number of transcripts in each dataset was substantially reduced, TTR – 2769441 to 414729, SSC – 2728965 to 377586, TLU – 3203445 to 548983, and MPO – 3675167 to 602418, allowing a better overview and understanding of the datasets (Online-only Table 5). After this step, we implemented another quality control strategy, the RBMT. This method, together with the already established metrics, general statistics, and gene completeness, allowed us to verify the raw read content of the transcriptomes. Importantly, this metric showed that even with the redundancy removal step, the RBMT rate in the non-redundant transcriptomes has kept very high values, TTR – 96.78, SSC – 97.16, TLU – 95.3, MPO – 95.51% (Online-only Table 5).
In the process of ORF prediction, the TransDecoder software identified TTR – 111866, SSC – 97811, TLU – 150334, MPO – 167124 transcripts with an assigned ORF. Importantly, the entire set of transcripts codifying for a protein was collected from the non-redundant transcriptomes and placed in files classified as final transcriptome assemblies38.
The basic metrics, BUSCO analyses and RBMT rates for TTR, SSC, TLU, and MPO final transcriptome assemblies are available in Table 3. Notwithstanding, the final transcriptome statistics demonstrate the power of the assembly and processing strategy chosen, with N50 values ranging from 2543 to 3700 bp, BUSCO values between 81.8–86.5% in Actinopterygii gene set, and raw reads rate mapping ranging from 91.45 to 94.63% (Table 3). Interestingly, the BUSCO analyses in Vertebrata and Actinopterygii gene sets still shown a decrease in the percentage of fragmented genes (less than half) and missing genes (slightly), in the final transcriptome assemblies when compared with the initial individual assemblies, for all species.
In the end, the final transcriptomes were functionally annotated using the Sma3s software. A high number of the transcripts were annotated and most of them including the gene name which suggests a remarkable quality of the assemblies. Annotation distribution across the different species is very similar, keeping a logical proportion based on the total number of transcripts. All the annotations stats, including the gene homology, the most probable gene name, the GO terms, Kegg Pathways and EC numbers for Enzymes can be consulted in Table 3 38.
Source: Ecology - nature.com

