Sample collection
All samples were taken from Salakphra Wildlife Sanctuary with the permission from the Department of National Parks, Wildlife and Plant Conservation (DNP), the approval number DNP 0907.4/4411. A research ethics statement was granted by the Mahidol University-Institute Animal Care and Use Committee (MU-IACUC 2016/026).
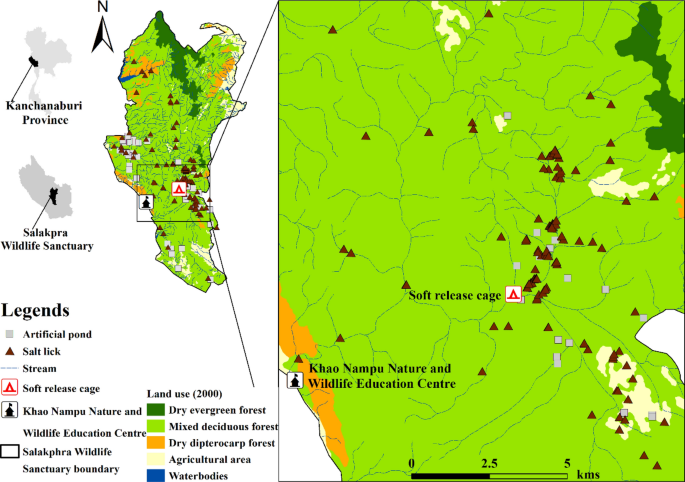
Salakphra Wildlife Sanctuary (14°8′37.09″N, 99°20′33.51″E, area: ~ 860 km2) is located in Mueang, Bo Phloi, Si Sawat and Nong Prue district, Kanchanaburi province, Thailand (Fig. 1). ArcView V.1222 and WEFCOM’s topographic data23 were used to generate the study area map. The height above sea level is between 700 and 1,000 m. The average rainfall is 1,071 mm year-1 with an average temperature of 28 °C. The vegetation cover is mixed deciduous forest (60%), dry dipterocarp forest (30%), and disturbed areas (10%). The dominant species in the habitat area are Lagerstroemia tomentosa, Terminalia alata, T. triptera, T. bellirica, and Afzelia xylocarpa24.
Location of banteng (Bos javanicus) presence and camera stations in Salakphra Wildlife Sanctuary. The study area map was created by used WEFCOM’s topographic data23 and ArcView V.1222.
Systematic reintroduction of banteng
Data were collected as previously potocols described in Chaiyarat et al.8,25,26 as methods and protocols from Chaiyarat et al. (2019) for systematic reintroduction of bateng (Bos javanicus) V.2.
Training of the banteng before reintroduction
During their time in captivity, the banteng underwent general medical checkups and received minimal human contact4,27. Seven captive-purebred banteng were kept in a 302 ha enclosure. Four adult males and three adult females between five and seven years old were trained to be habituated with transportation boxes (1 m × 2.5 m × 1.8 m, width × long × high) individually in a 0.2 ha cage for six months at the Khao Nampu Nature and Wildlife Education Center for eight months8 before being translocated into a soft release cage28 at Salakphra Wildlife Sanctuary, for four months before release. In soft release cage, they were kept in groups prior to release. In captivity, the captive-bred banteng were provided with Zea mays Linn., Hymenachne pseudointerrupta C. Muell, Hewittia malabarica (L.) Suresh., Trichosanthes cucumerina L., fresh water and artificial salt licks. While in the training cage, the captive-bred banteng were fed a diet composed of the natural plants that were found in the cage. After reintroduction, the natural food plants and salt-licks were the main nutritional resources of the reintroduced banteng that may influence the body condition scoring and physiological states of the animals29.
Systematic reintroduction of banteng
All banteng were immobilized with anesthetic drugs: (1) Thiafentanil Oxalate 0.015 mg kg−1 (Thianil, Wildlife Pharmaceuticals (Pty) Ltd., South Africa) and (2) Medetomidine HCl 0.015 mg kg−1 (Kyron Laboratories (Pty) Ltd., South Africa); and reversal drugs: (1) Naltrexone 30 times of Thiafentanil Oxalate (Thianil, Wildlife Pharmaceuticals (Pty) Ltd., South Africa) and (2) Atipamizole HCl 5 times of Medetomidine HCl (Kyron Laboratories (Pty) Ltd., South Africa), ATIPAM (Eurovet Animal Health, the Netherland) by veterinarians of DNP and The Zoological Park Organization under the Royal Patronage of His Majesty the King (ZPO) and fitted with radio collars (< 3% of body weight, very high frequency (VHF) transmitters; Advanced Telemetry Systems (ATS), Isanti, MN) using standard capture and marking practices30 prior to transport to Salakphra Wildlife Sanctuary. Radio collar signals were tested in the soft release cage before the banteng were reintroduced. First, collar signals were examined for one week after reintroduction to reduce the bias when the banteng were initially released to their new habitat. The radio collared banteng were monitored periodically every week through ground tracking, using homing in and triangulation techniques31 via VHF signals. As described in Chaiyarat et al.8, four individuals of captive-bred banteng were reintroduced in December 2015 (dry season is between November and April) and the other three individuals were reintroduced in July 2016 (wet season between May and October) for six-month gap chosen in part to reduce the potential risk of losing reintroduced banteng.
Samples from forage species (Zea Mays L. and Broussonetia papyrifera (L.) L’ Hér. ex Vent.) and salt lick blocks were collected from the banteng diet during captivity in 2016. Natural forage species were collected for fecal analysis. Thirty dung samples per season were collected (100 g sample-1) after the banteng were reintroduced into their natural habitat. Samples were boiled with tap water for 30 min, followed by the addition of concentrated NHO3 (90%) and boiled for another 10 min. After boiling, the samples were drained and the extracts adjusted with tap water to have a volume of 50 ml. Five drops of Xylene were added to preserved the extracts. Ten pieces of forage in each sample were examined using a 40X lens under aolight-microscope. Photos of all samples were taken and compared with references slides32 in both wet and dry seasons.
The sera of three banteng (20 ml per individual) were collected by veterinarians of DNP and ZPO during immobilization before being translocated into the training cage in 2016. The sera were kept at room temperate (25ºC) for 24 h before centrifuged. Sera were centrifuged at 3,000 rpm for 15 min and stored in eppendorf tubes 1.5 ml) at -20ºC before being analyzed33.
The dung of three banteng was collected in an encroacher (30 dung samples) and in the natural forest after release (30 dung samples per season) in 2016. Dung was aliquoted into 30 g samples and dried in a hot air oven at 60ºC for 24 h. The samples were ground in a Wiley mill and filtered using a 0.05–0.1 mm sieve.
Nutritional analysis
Seras, dungs, forage and salt-lick blocks were analyzed according to the guidelines of the Food and Agriculture Organization of the United Nations (FAO)34. Samples were analysed by placing 2 g aliquots into a Kjeldal flask along with 0.1 g of CuSO4 and 2 g of NaSO4. Then, 25 g of concentrated sulfuric acid was added and shaken. The samples were digested using a temperature gradient starting at 50ºC and rising to 400ºC. Samples were digested until the color of the digest wasbright and clear. After digestion, 15 ml of deionized water and 50 ml of 40% NaOH was mixed in a receiving flask with 25 ml of 4% boric acid. added 4 drop of indicator until the color of solvent was bright pink. Solvent was titrated with 0.1 N HCl until sovent changed color from green to middle purple and doing the blank of sample.
Ascorbic Acidemolybdate method was used to analyse P in serums, dungs, and forages. Samples weighing 2.0 g were placed in a 125 ml Erlenmeyer flask with 10 ml of HNO3 and 5 ml of HClO4. Samples were digested on a hot plate until the color of the solution was bright and clear. After cooling to room temperature, the volume of the solution was increased to 50 ml using deionized water. The solution was passed through a no. 42 filter into a 100 ml volumetric flask, shaken and waited. A 1 ml aliquot of sample extract was mixed with 5 ml of vanadomolybdate, shaken and kept at 25ºC for 20 min. The optical density of the resulting solution was measured at 420 nm by UV–Spectrophotometer. The concentration of P in samples was calculated by comparison with standard solutions.
Atomic Absorption Spectroscopy (AAS) was use to analyse K and Ca in serums, dungs, and forages. Samples weighing 2 g were placed in a 200 ml Erlenmeyer flask with 10 ml of HNO3 and 5 ml of HClO4. Samples were digested on hot plate until the color of the digest was bright and clear, the cooled to room temperature. Digests were filtered using no. 42 filter paper and kept in 25 ml volumetric flasksuntil assayed by Atomic Absorption Spectroscopy (AAS). Standard solutions of potassium at concentration 0, 2, 4, 6, 8 and 10 ppm were prepared. Measurements of potassium by Flame-Atomic Absorption Spectroscopy (FAAS) were performed at the Salaya Central Instrument Facility (SCIF), Mahidol University.
Micro nutrients, Fe, Cu, and Zn were measured by Graphite-Atomic Absorption Spectroscopy (GAAS). Sample aliquots weighing 0.5 g were placed in a 75 ml Erlenmeyer flask with 5 ml of HNO3:HClO4 (2:1). The sample was digested on hot plate for 3 h and cooled to room temperature, filtered using Whatmann paper No. 42, and adjusted to a total volume of 25 ml with deionized water. The concentrations of Fe, Cu, and Zn were determined using GAAS at the SCIF, Mahidol University.
Statistical analysis
Mineral compositions of seras, dung samples, and forage species before and after reintroduction were compared using one-way ANOVA. Chi-square test was used to compare the significant differences among forage species between the wet and dry seasons. All significant differences are reported at p < 0.05 by using Statistical Product and Service Solutions (SPSS).
Source: Ecology - nature.com
