Microbial interactions are dependent on diversity and time since inoculation
The link between increasing biodiversity and primary productivity is well-established in environmental bacteria, and our results confirmed this relationship in clinical isolates (Fig. 1a) was significant (β48 = 1.49 ± 0.46 log10(colony forming units (cfu) ml−1) species−1, R2 = 0.29, p = 0.003) over time scales encompassing initial growth, but became non-significant (β168 = 0.79 ± 0.39 log10(cfu ml−1) species−1, R2 = 0.14, p = 0.051) as the community established. This indicated that the influence of increasing diversity reduces over time, which is thought to be a function of changing resource availability. If we consider these positive biodiversity-productivity relationships in situ, then it would be expected that the more diverse a community, within a patient’s respiratory tract, the greater the bacterial load. Research suggests, however, that this is not the case, with many patients having constant bacterial loads5. This is likely due to the disparate regions of the respiratory tract24. The interactions indicated in this study are therefore most likely localised to pockets within the lung as seen with other, structurally complex environments25. This could be a cause of localised airway damage, through recruitment of neutrophils26, but further work is needed to understand the implications of these ecological observations.
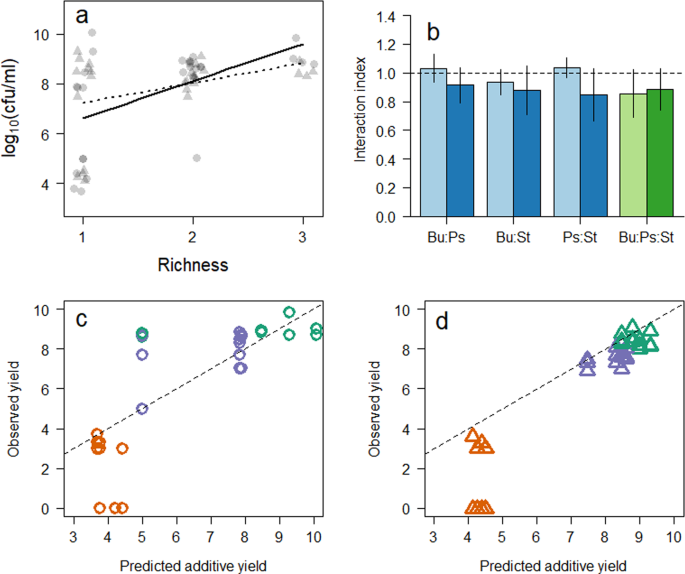
Changes in bacterial growth and media due to composition and time. (a) Biodiversity ecosystem function plot of bacterial biomass against microcosm richness after 48 (circles) and 168 (triangles) hour incubation. Relationship is significant after 48 (solid line) but not after 168 hours (dotted line). (b) Mean (±standard deviation) interaction index, calculated as a ratio of observed to expected bacterial yield, where values > 1 represents positive interactions, 1 no interaction (dashed line), and <1 negative interactions. Blue bars represent two species co-cultures, green bars are three species co-cultures. Observed to predicted yields of the individual isolates after (c) 48 and (d) 168 hours incubation, where green, orange and purple points represent Pseudomonas, Burkholderia and Staphylococcus isolates respectively.
To understand the impact changing combinations had on the growth of the bacteria in the microcosms, we predicted the primary productivity of the microcosms based on the productivity of the monocultures (assuming no interaction so the growth would be additive18,27) and compared to the observed productivity2,18,28. Here, values >1 represents positive interactions, 1 no interaction, and <1 negative interactions18. We found a significant difference (F1,27 = 7.84, p = 0.009) in mean change (mean ± 1 s.e. throughout) in abundance (48 hours: −0.44 ± 0.47; 168 hours: −1.88 ± 0.42 log10 (cfu ml−1)), suggesting that antagonism increases the longer the bacteria cohabited (Fig. 1b). This is in contrast to previous studies that indicate the reduction in antagonistic interactions over time, due to niche differentiation2. We therefore postulated that this increase in apparent competition was due to a direct exclusion of one bacteria by another.
To test this postulation, the effects of each isolate on the others in co-culture was monitored by calculating the difference in abundance change from the predicted productivity for each isolate individually. Our results indicated that there was no significant change in abundance for the Pseudomonas (1.19 ± 0.004, One-sample Wilcoxon rank test (µ = 1) p = 0.783) and Staphylococcus (1.15 ± 0.004, p = 0.142) isolates, whereas the Burkholderia isolate performed significantly worse (0.46 ± 0.031, p = 0.003) when in co-cultures after 48 hours incubation (Fig. 1c). After 168 hours, all the isolates had significantly reduced in their mean observed to predicted ratio (Fig. 1d); Burkholderia (0.25 ± 0.037, p = 0.002) Pseudomonas (0.95 ± 0.030, p = 0.016), Staphylococcus (0.92 ± 0.021, p = 0.004). This result supported our postulation that the reduction in overall ecosystem function was due to the exclusion of the Burkholderia isolate by the other bacteria. With the removal of this isolate from many of the microcosms, the Pseudomonas and Staphylococcus isolates may have expended energy out-competing the Burkholderia, thereby losing any potential synergistic benefit. Whilst we observed no evidence as to the direct effects of inhibitory second metabolites there is evidence that specific antagonistic interactions do occur in similar microcosm experiments22. It is therefore possible that specific, non-resource mediated interactions caused the apparent extinction (isolate fell below the detection limit of 50 cfu ml−1), as previously observed in co-culture experiments29. There has been no study that investigates the relative contributions of different mechanisms of competition (i.e. ecological or chemical) despite much literature stressing the interplay30,31,32,33, however, there are an increasing number of studies22,27,29,34,35,36, including this one, where this holistic approach would be greatly informative.
Niche overlap
Having found that the Burkholderia isolate was excluded by the other two isolates, we used 1H NMR to understand how this was possible, and tested the mechanism of competition as either due to competitive exclusion by removal of nutrients or through the production of toxic secondary metabolites. By taking integrals of the 1H NMR spectra at 0.05 ppm intervals (Supplementary Figs. S1 and S2), and calculating the differences between the monocultures and the blank samples we could identify relative changes in the media. At the first time points (Fig. 2a–c), these differences in integrals indicated that changes were predominantly (62.56%, n = 274) positive (creation of new metabolite), with the remainder (37.44%, n = 164) of integrals decreasing (degradation of nutrient) in intensity. Over time, the number of positive and negative integrals became equivalent; 50.91% (n = 223) positive and 49.09% (n = 215) negative integrals (Fig. 2d–f). Using these data, the niche overlap was calculated between the isolates. There was a significant (χ23 = 30.38, p < 0.001) increase in overlap in the latter time point across the combinations, suggesting that the bacteria were competing for the same resources. This may have been due to the low diversity media (carbon sources were almost entirely amino acids11) the bacteria were grown in, therefore the opportunity for niche diversification was limited. This increase in overlap was strongly, albeit non-significantly, correlated (Rho = −0.619, p = 0.115) with a reduction in the mean observed to predicted ratio in each of the microcosms (Supplementary Fig. S3). Interestingly, the Pseudomonas isolate was observed to have a greater number of negative integrals than either of the Burkholderia and Staphylococcus isolates. This is likely due to P. aeruginosa being an generalist through its ability to adapt rapidly to the lung environment37. With the increasing overlap in resource utilisation, this is an example of competitive exclusion in bacteria38, and further explains the extinction of the Burkholderia isolate.
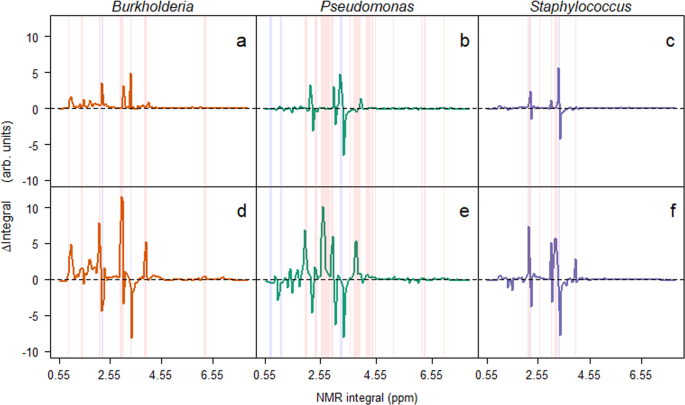
Bacterial induced changes in 1H NMR integrals for microcosms at the two time points. Changes in integrals (Δ integrals) were calculated by subtracting integrals for the no bacteria control samples from the integrals recorded from microcosm media from microcosms containing bacteria in monoculture. Mean Δ integrals are plotted against the location (ppm) of the integral. Red and blue columns represent integrals that significantly increase and decrease, respectively, from the first (a–c) to second time point (d–f).
Changes in environment are indicative of community structure
To understand the interplay between environmental modification and changes in bacterial interactions, we plotted the interactive index (predicted/observed)18 using the integrals measured in microcosms with monocultures added together as the predicted. This indicated that as the isolates grew, the number of significant interactions (change in integral > mean change ± 2 s.d.) increased significantly (χ23 = 32.39, p < 0.001) from 48 (Fig. 3a) to 168 hours (Fig. 3b).
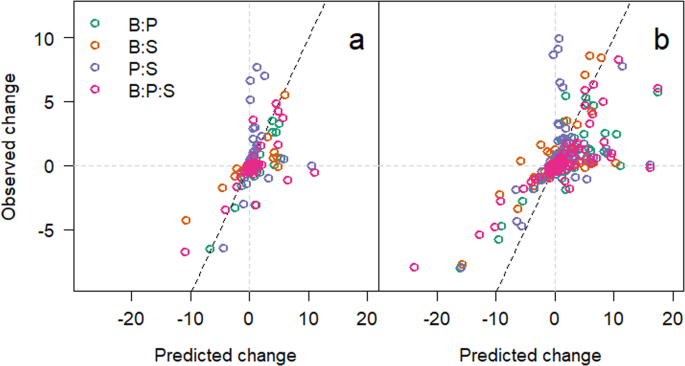
(a) Interaction index of each 1H NMR integral for the medium in each microcosm at 48 hours. Green circles are integrals taken from microcosms with Burkholderia and Pseudomonas, orange for Burkholderia and Staphylococcus, purple for Pseudomonas and Staphylococcus, and pink for all three species together. (b) Interaction index for 168 hours incubation. Grey dotted lines indicate the zero lines with the dotted black line showing the relationship if there were no interactions (1:1) for comparison.
To demonstrate the differences between samples, the readings from the first were subtracted from the second time point. The results indicated that the primary Principle Component Analysis (PCA) clustering (Fig. 4a) was based on the abundance of Pseudomonas (R2 = 0.32, p = 0.006) and Staphylococcus (R2 = 0.21, p = 0.023) at the final time point, but not Burkholderia (R2 = 0.08, p = 0.314)(Fig. 4b). The primary PCA axis was primarily correlated to the abundance, or absence, of the Pseudomonas isolate within a microcosm (Fig. 4b), and was determined by changes in 10 integrals (Fig. 4c). The mean change in integral was plotted against the primary PCA axis for microcosms depending on Pseudomonas presence (Fig. 4d). For microcosms containing Pseudomonas, these values had a significant positive relationship (β = 16.91 ± 0.82, F1,145 = 419.53, p < 0.001); conversely, those microcosms where Pseudomonas was absent had a significant negative relationship (β = −8.55 ± 1.08, F1,145 = 62.96, p < 0.001). This detailed investigation of the 1H NMR profiles suggests a potential mechanism that facilitates the domination of Pseudomonas, as evident in these microcosms. Whilst we cannot exclude the possibility of the secretion of inhibitory molecules (e.g.29), our data highlight the ability of the Pseudomonas isolate to utilise secondary metabolites created by other bacteria. We do not observe a reciprocal relationship between the Burkholderia and Staphylococcus isolates and metabolites produced by the Pseudomonas isolate. Putative identification of the 1H NMR peaks, suggest that those that significantly increase in the presence of Pseudomonas are derivatives of the amino acid serine, potentially the quorum sensing molecule homo-serine lactone39. As these data indicate an increase in the serine-associated peaks at the second time point compared with the first, this would equate to the Pseudomonas isolate being at stationary phase with no fresh intake in nutrients, therefore a decrease in metabolism would be beneficial40. Conversely, the peaks produced by the Burkholderia and Staphylococcus isolates, that are used in the microcosms with Pseudomonas, correspond with protons attached to a carbon atom, adjacent to an aromatic ring. There is evidence that aromatic compounds have an inhibitory effect on Pseudomonas species’ competitiveness41. Due to the evolutionary history shared by these isolates (i.e. having come from the same environment, potentially in close proximity to one another), the Pseudomonas isolate could have evolved to metabolise these compounds produced, as a defence mechanism, by its competitors. Further work would be required to know whether this is a true mechanism. Our data strongly suggest that cross feeding occurs between the bacteria, on an ecological timescale and not limited to evolutionary times16, ultimately to the advantage of the Pseudomonas isolate. This media was used to mimic the chemical conditions experienced in the lung environment from which these bacteria were isolated11,42. Previous studies have indicated that the transcriptomic expression profiles are highly similar in synthetic cystic fibrosis medium to those observed in their natural environment43,44. As such, we believe that this mechanism of unidirectional cross-feeding is likely to be present in natural systems and should be investigated further.
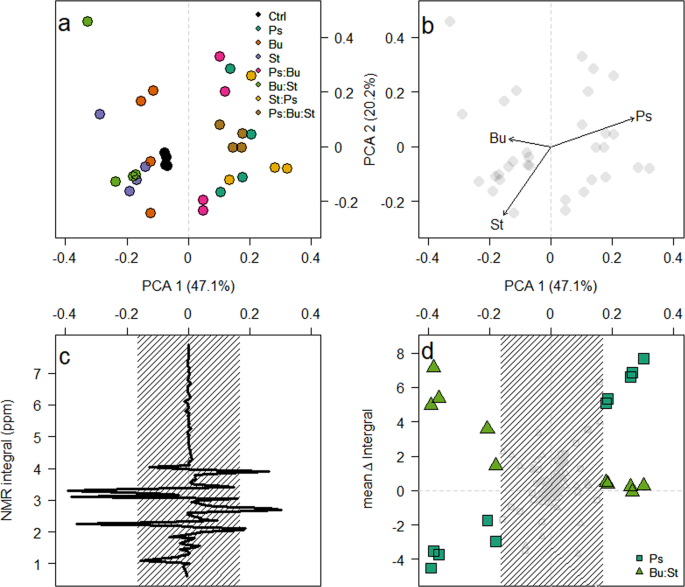
The modification of media is dependent on the composition of the microcosm. (a) PCA ordination plot of the difference in 1H NMR integrals between sampling points. (b) Correlations between the abundance of each isolate at the final time point was assessed and the shift in PCA1 was indicated to be due to the growth of Pseudomonas. (c) Loading plot of PCA1 against the 1H NMR integrals. Peaks were deemed significant if they lie outside the shaded region (mean ± 2 standard deviations). Finally, (d) indicates the mean change in integral for microcosms that contain the Pseudomonas isolate (squares) and those that do not (triangles).
Source: Ecology - nature.com