eDNA memory effect in soils
DNA analyses highlight the presence of the last cultivated crops (< 7 years) in conventional and conservation farming. They also underline the ability of these methods to detect a large variety of weeds under both agricultural practices. Results from the analyses highlighting the memory effects for both farming practices are detailed below.
Conventional farming
eDNA analyses for plot 1 have indicated the dominance of the last crop barley (Hordeum, MTR (Mean Total Reads) 95%, SD (Standard Deviation) 18%). Wheat (Triticum) cultivated in LC-1 (Last cultivated Crop: LC–X correspond to the crop cultivated X years before the sampling survey) was not detected whereas the LC-2 crop, rape, was identified (MTR, 1.3%, SD 0.75%). Between year LC and LC-1, soil was ploughed when direct seeding was performed between LC-2 and LC-1. The OTMC (One Time Marker Crop) identified for this plot in LC-16 (pumpkin, Cucurbita maxima) was not detected. In plot 1, eDNA analyses detected only two crop species (barley and rape) and three weed species (bindweed (Convolvulus), ryegrass (Lolium perenne) and black nightshade (Solanum nigrum)) (Fig. 2).
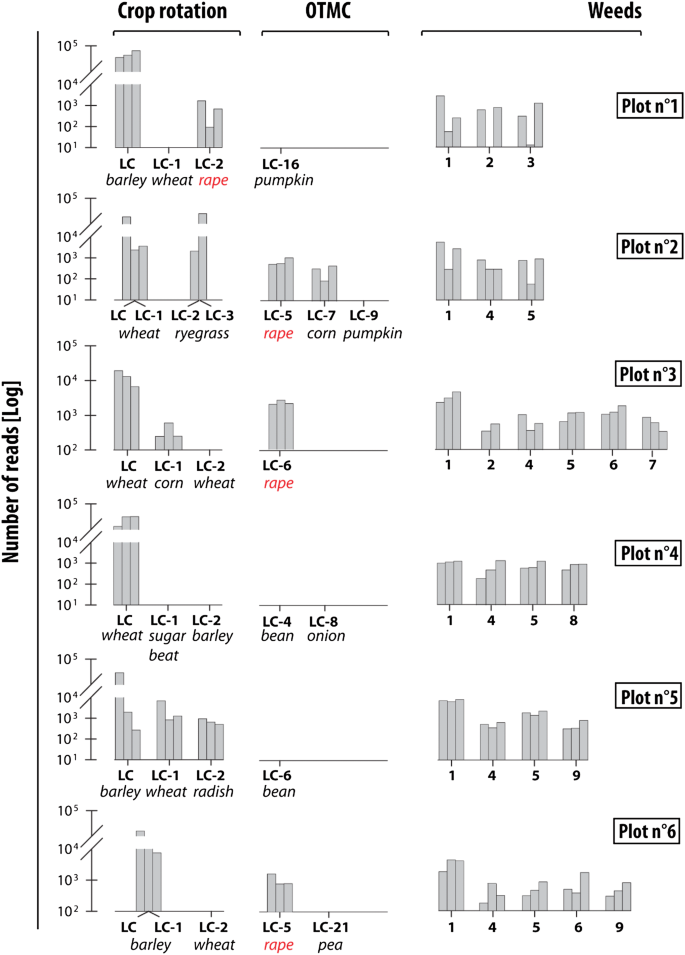
Abundance of crops and weeds taxa identified by eDNA analyses under conventional farming. The 3 bars correspond to the 3 replicates for each site. LC corresponds to the last crop and LC-X to the crop cultivated x year(s) before the last crop. OTMC corresponds to Time Marker Crops. (1) bindweed (Convolvulus) (2) ryegrass (Lolium perenne) (3) black nightshade (Solanum nigrum) (4) knotweed (Fallopia convolvulus) (5) healtyfoin (Onobrychis viciifolia) (6) clover (Trifolium) (7) buttercup (Rananculus) (8) oatmeal (Avenula) (9) field gromwell (Lithospermum arvense).
For plot 2, wheat was cultivated during two successive years (LC and LC-1). The field was then occupied by an artificial grassland for 2 years (i.e. LC-2 and LC-3). During this period, this plot was converted into grassland and covered with a weed, ryegrass. eDNA was strongly variable among the three samples collected in this field with the first replicate demonstrating the dominance (75%) of the last crop whereas sample three indicated the dominance of grassland weeds (91%) (Fig. 2). For this plot, three OTMC were known. The OTMC in year LC-5 (rape) was clearly identified (MTR 2.5%, SD 1.7%) along with the OTMC LC-7 (corn (Zea mays)—MTR 1%, SD 0.75%). Contrarily, the LC-9 OTMC (pumpkin) was not identified. In addition to ryegrass, the weed population included three other taxa in plot 2 including bindweed, knotweed (Fallopia convolvulus), healtyfoin (Onobrychis viciifolia).
Results for plot 3 indicate the dominance of the last crop, wheat (MTR 42%, SD 10%) (Fig. 2). The LC-1 crop (corn) was detected in lower proportions (MTR 1.1%, SD 1.7%). Between the LC and LC-1, the soil was ploughed. The DNA results demonstrated the presence of rape (MTR of 10%, SD 5.4%) which was cultivated in LC-6. These reads can also be attributed to the mustard (Sinapis alba))—(intercultural crop) directly sown in the last crop residues four weeks before the sampling survey. These two species were not clearly distinguished. Plot 3 was one of the sites that were the most impacted by weeds. As a consequence, a large number of weed taxa were recorded in this field (i.e. bindweed, ryegrass, knotweed, healtyfoin, clover (Trifolium), buttercup (Rananculus)).
In plot 4, the last crop (wheat), accounted for 81% of MTR (SD 25%). Sugar beet, the LC-1 crop and barley, the LC-2 crop, were not identified in this field. The soil was ploughed between the LC and LC-1 and also between LC-1 and LC-2. Rape, which was never cultivated in this plot, constituted ~ 13% of MTR (SD 4%). These reads can be attributed to the intercultural crop of the same family as rape between LC-1 and LC-2. Both OTMC identified in years LC-4 (bean, Phaseolus vulgaris) and LC-8 (onion, Allium cepa) were not detected. At plot 4, eDNA analyses detected two crops and four different varieties of weeds (Bindweed, knotweed, healtyfoin and oatmeal (Aveluna)) (Fig. 2).
eDNA results for plot 5 indicated the dominance of the last crop, barley (MRT 46%, SD 40%) followed by the LC-1 crop (wheat)—(MRT 9.2%, SD 10.3%) and the LC-2 crop (radish)—(MRT 2.2%, SD 0.7%). OTMC identified in year LC-6 was not recorded (bean). In addition to these crops, four weeds were detected (i.e. bindweed, knotweed, healtyfoin and field gromwell (Lithospermum arvense)).
Plot 6 was dominated by barley (MTR—70%, SD 30%) cultivated in LC and LC-1. Wheat which was cultivated in LC-2 was not evident in the samples. The soil was ploughed between LC and LC-1 as well as between LC-1 and LC-2. The OTMC identified in LC-5 (rape) was detected in low proportions (MTR 5%, SD 2.7%). Five weed species (i.e. bindweed, knotweed, healtyfoin, clover and field gromwell) were identified along with two additional crop species (barley and wheat).
Conservation farming
On the first field (plot 7), although wheat was grown in LC and LC-2 (wheat), this crop was only detected at low levels (MTR 1.2%, SD 0.6%). Corn cultivated in LC-1 was not identified (Fig. 3). Rape, which was cultivated in LC-3, had the highest MTR (MTR 58%, SD 99%). Barley was also detected (MTR 7%, SD 4.5%). To the best of our knowledge, barley has never been cultivated in this plot during at least 25 years, but it is cultivated in a nearby field (distance from the barley field ≈ 10 m). The most abundant weeds specie was bindweed (MTR 14%, SD 8.7%). In total, five different weeds were detected on this plot (bindweed, ryegrass, artemisia (Artemisia vulgaris), knotweed, healtyfoin). The OTMC planted in LC-8 (potatoes, Solanum tuberosum) and LC-10 (peas) were not identified by eDNA analyses (Fig. 3).
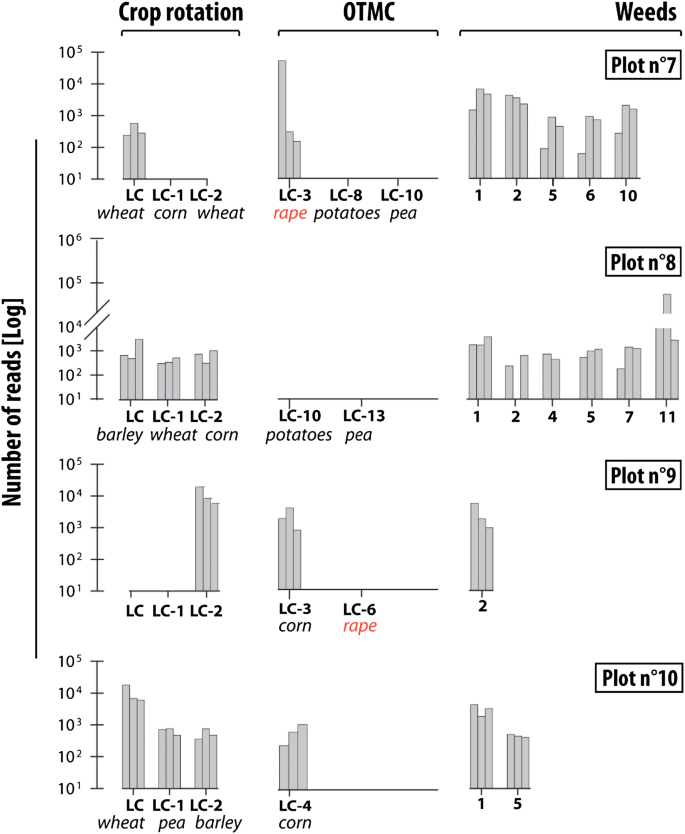
Abundance of crops and weeds taxa identified by eDNA analyses under conservation farming (i.e. no-tillage). The 3 bars correspond to the 3 replicates for each site. LC corresponds to the last crop and LC-x to the crop cultivated x year before the last crop. OTMC corresponds to Time Marker Crops (1) bindweed (Convolvulus) (2) ryegrass (Lolium perenne) (3) black nightshade (Solanum nigrum) (4) knotweed (Fallopia convolvulus) (5) healtyfoin (Onobrychis viciifolia) (6) clover (Trifolium) (7) buttercup (Rananculus) (8) oatmeal (Avenula) (9) field gromwell (Lithospermum arvense) (10) Artemisia (Artemisia vulgaris) (11) Non attributed, family of Bryaceae.
For plot 8, results indicated the dominance of a moss (non-attributed species of Bryaceae family: MTR 77%, SD 88%). The three last crops were identified, respectively barley (LC—MTR 5%, SD 4.7%), wheat (LC-1—MTR 2%, SD 1.4%) and corn (LC-2—MRT 2%, SD 1.2%). In addition to these crops, six weeds were recorded on this site (i.e. bindweed, healtyfoin, knotweed, clover, ryegrass and a non-attributed species from Bryacea family). OTMC known in LC-10 (potato) and LC-13 (pea) were not detected.
Results obtained on plot 9 indicated the detection of the wheat cultivated in LC-2 (MTR 66%, SD 35%) and one weed (ryegrass: MTR 21%, SD 12%). The last crop cultivated in LC and LC-1 (barley) was not detected. OTMC known in LC-3 (corn) was identified at this site (MTR 10%, SD 8%).
In the last plot (plot 10), the three last crops cultivated were detected, respectively wheat in LC (MTR 61%, SD 39%), peas in LC-1 (MTR 4.6%, SD 3.3%) and barley in LC-2 (MTR 3.1%, SD 3.9%). OTMC corn cultivated for the last time in LC-4 (MTR 3.9%, SD 3.3%) was detected. In addition to these crops, two weeds were detected (bindweed and healtyfoin).
Weed population
A large variety of weeds were identified by the eDNA analysis in addition to the main cultivated plants. Among these weeds, bindweed was identified in 100% of the fields under conventional farming and in 75% of the fields under no-tillage. This species was more abundant than the crop cultivated during LC-1 in 78% of cases. Furthermore, ryegrass was detected in 34% of the fields under conventional farming and in 75% of those under no-tillage. Ryegrass detection was particularly high in plot no. 2 where the MTR of this weed was 43% (SD 68%), which is similar to that of the last crop (MTR 40.5% SD 52%). In addition to these two ubiquitous weeds, other weed taxa were found in a large number of fields (a total of 11 different weeds were recorded in the Fromonvilliers site). Among these species, knotweed was detected in six plots and, again, healtyfoin was detected on seven plots (Figs. 2 and 3).
eDNA as a marker of land cover
eDNA results obtained for comparing the relative abundance of the last observed crop allow the identification of the last species in 84% of fields. Under grassland, forest and channel bank environments, the expected dominant species were detected as the most abundant. Results also showed the detection of grapevine eDNA. This species is no longer cultivated at this site, but it was cultivated until 65 years ago and was identified in 45% of the sampled plots including grassland and channel bank environments.
Cropland
During the fieldwork survey, rape was the only summer crop found in the Louroux catchment. eDNA results obtained for the samples collected in fields planted with rape (n = 6) showed that this species was identified in all the sampled plots. However, a high variation in abundance was observed for this species, with a rape contribution of MTR 34% (SD 31%)—(Fig. 4). Rape was detected as the most abundant species in 67% of the plots. Other taxa detected in these fields were dominated by weeds (e.g. knotweed, MTR 8%, SD 9%)—(Fig. 4).
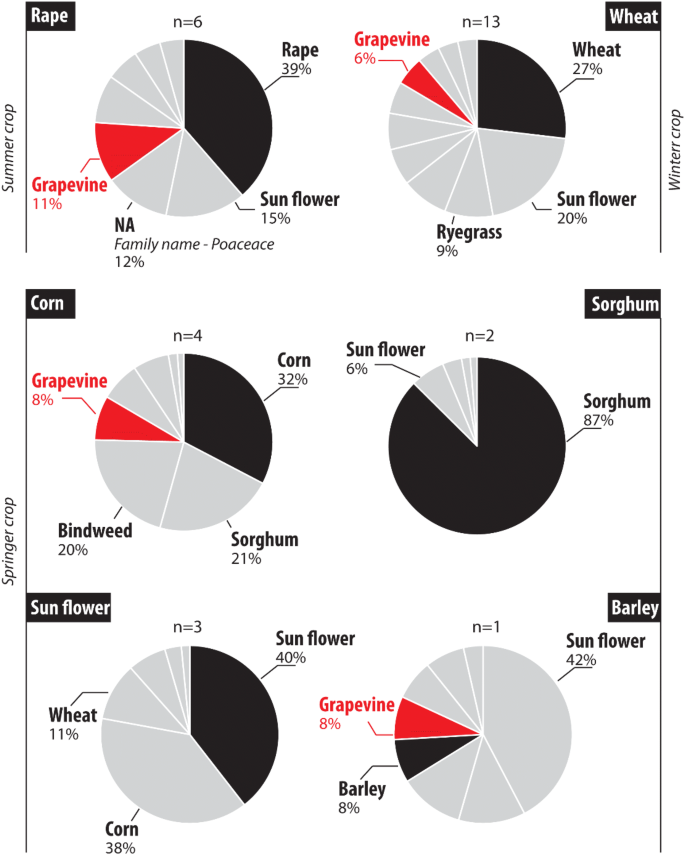
Expected versus identified species using eDNA analyses for the Louroux site. Individual pie chart corresponds to the average values per crop type (n = number of plot(s) sampled per crop type). The last cultivated crop was highlighted in black. NA Non attributed species.
Wheat was the main winter crop cultivated in the Louroux catchment during the survey. This species was detected in all the fields sampled (n = 12) with an abundance ranging between 1 and 96% (Fig. 4). In winter crops, eDNA analyses led to the identification of 11 different species. Among these, the four most abundant taxa detected were wheat (MTR 23%, SD 33%), sunflower (MTR 17%, SD 20%), ryegrass (MTR 8%, SD 8%) and vetch (MTR 7%, SD 8%). Ryegrass was identified in 75% of the plots, rape in 58%, grapevine in 33% and corn in 25% of the fields. Wheat was identified as the dominant taxon in only two plots (Fig. 4).
A large variety of crops were sown in the Louroux site during spring. In plots where corn was planted, this species was identified in three of the four sampled plots. Contribution of this species ranged between 0 and 57%. Sorghum was the most abundant in the plot where the corn was not identified. Among the four most abundant crops detected in the four sampled sites, corn had the highest occurrence (MTR 30%, SD 23%), followed by sorghum (MTR 20%, SD 39%), bindweed (MTR 20%, SD 23%) and grapevine (MTR 7%, SD 3%). In plots previously cultivated with sorghum, this species was the most abundant (MTR 74%, SD 9%) followed by bindweed (MTR 3%, SD 1%). In plots previously cultivated with sunflower, this species was detected in all the sampled sites (n = 3) (Fig. 4). Contribution of this plant to the MTR ranged between 3 and 60%. It was the most abundant taxon in two of the three samples (MTR 32%, SD 29%). In addition, corn (MTR 31%, SD 53%), wheat (MTR 9%, SD 12%) and ryegrass (MTR 6%, SD 5%) were also detected. Only one field previously cultivated with barley was sampled. In this plot, the barley contribution amounted to 8%. Sunflower was the most abundant taxon detected in this land cover (MTR 30%) followed by ryegrass (MTR 11%), barley and wheat (MTR 6%)—(Fig. 4).
Uncultivated land
eDNA results obtained in forested areas (n = 3 samples) showed the dominance of trees (Fraxinus—MTR 18%, SD 32%), shrubs (Rhamnus—MTR 5%, SD 7%) and climbing ivy (Hedera helix—MTR 66%, SD 26%) (Fig. 5). Climbing ivy was the most detected in two of the three collected samples. Trees and shrubs were the second most abundant plants. In the forest plots, six species were detected. Importantly, no cultivated plant was identified under this land use.
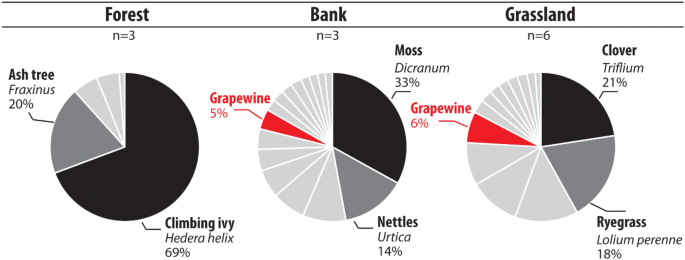
Expected versus identified taxa in forest, river channel bank and grassland environments using eDNA analyses for the Louroux site. Individual pie chart corresponds to the average values per environment type. The more abundant species were highlighted in black and dark grey.
Seven species were identified in samples collected in permanent or temporary grassland plots (n = 6). Among them, ryegrass (MTR 18%, SD 18%), clover (MTR 21%, SD 34%) and alfalfa (MTR 13%, SD 32%) were the dominant species. These taxa were respectively detected in 84%, 33%, 15% of the plots. Grapevine was detected in 65% of the samples (MTR 6%, SD 8%), and rape was detected in 50% of the plots (MTR 10%, SD 16%).
A total of 14 different taxa were identified in channel banks (n = 3). The three samples were all characterized by the detection of specific species. The most abundant plants recorded in this environment were ryegrass (MTR 8%, SD 14%), moss (MTR 30%, SD 50%) and nettle (Urtica—MTR 13%, SD 22%). Importantly, no cultivated plant was detected in this land use (Fig. 5).
Source: Ecology - nature.com
